
Bitcoin Price Prediction – December 8
The Bitcoin price prediction continues sideways movement currently at $50,608 after another significant rejection from $51,250.
BTC/USD Long-term Trend: Ranging (Daily Chart)
Key levels:
Resistance Levels: $56,000, $58,000, $60,000
Support Levels: $44,000, $42,000, $40,000
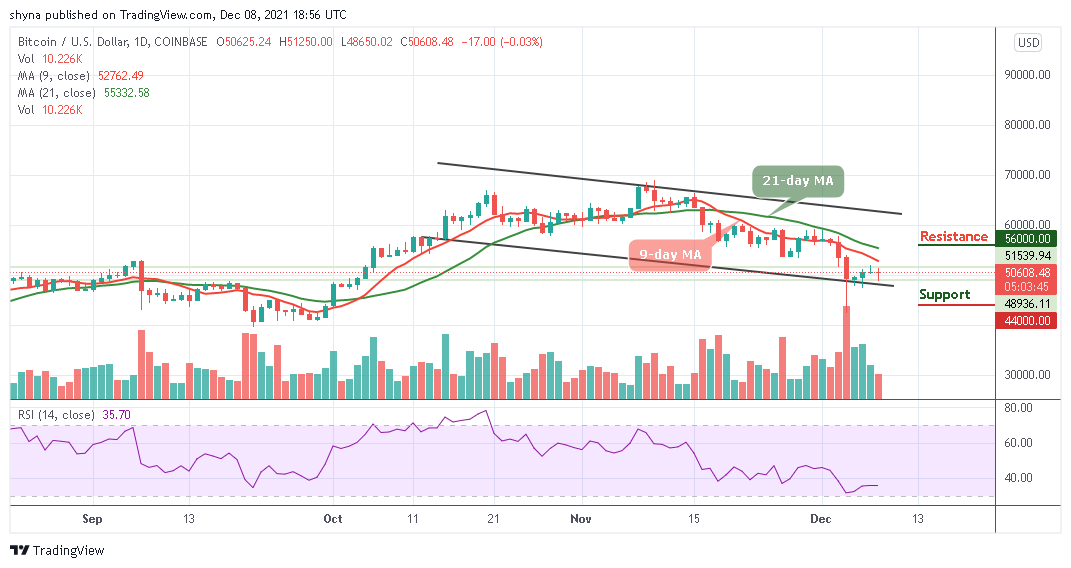
Looking at the daily chart, after serious downtrend, BTC/USD is still flat and trading sideways but has seen a volatile move, peaking at around $51,250 before quickly dropping to $50,608.48 below the 9-day and 21-day moving averages. Therefore, one can say that the Bitcoin (BTC) price is likely to continue with sideways movement before dropping below the channel.
Bitcoin Price Prediction: What could be the Next Direction for Bitcoin?
According to the daily chart, the Bitcoin price is trading at $50,608 with a slight loss of 0.03%. However, the prevailing trend is ranging from expanding volatility as the first digital asset continues to consolidate in a bearish flag pattern. Meanwhile, a breakdown from this pattern is supposed to continue in the direction of the previous trend. On the contrary, traders expect BTC/USD to rise above the 9-day moving average before moving towards the potential resistance levels at $56,000, $58,000, and $60,000.
Furthermore, should Bitcoin price breaks below the lower boundary of the channel; the price may head towards the $48,000 vital support. A further low drive could send the price to $44,000, $42,000, and $40,000 support. The technical indicator Relative Strength Index (14) is seen moving sideways, which makes the market to be indecisive at the moment.

BTC/USD Medium – Term Trend: Ranging (4H Chart)
On the 4-hour chart, we can see that the bears are likely to step back into the market, trading around the 9-day moving averages. Meanwhile, the $48,000 and below may be visited if BTC/USD breaks below the 21-day moving average.
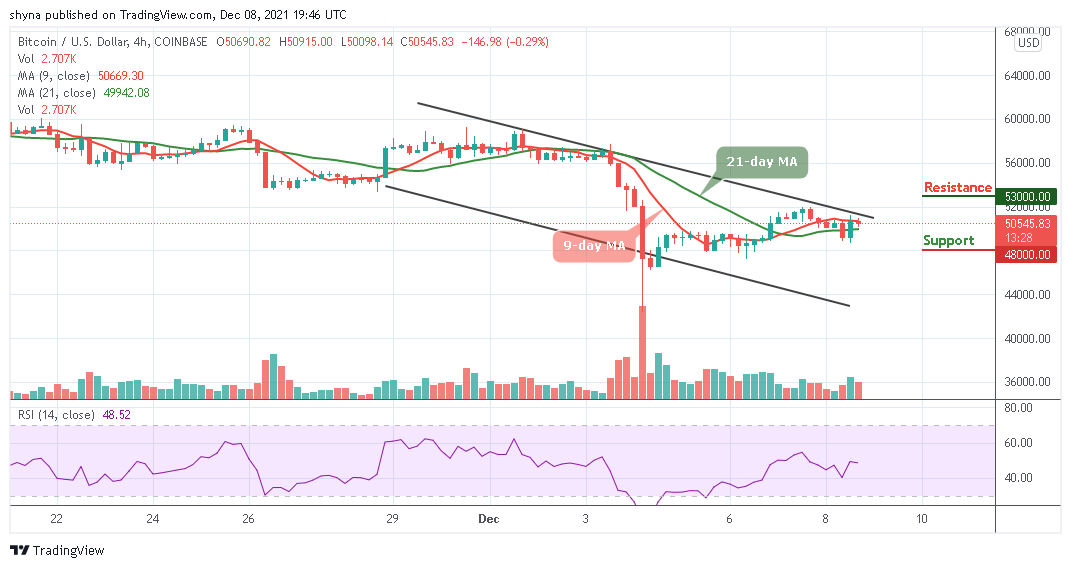
However, if the buyers can push the market to the north, traders may expect a break above the upper boundary of the channel. Breaking the mentioned barrier may further allow the bulls to touch the resistance level of $53,000 and above but the technical indicator Relative Strength Index (14) is moving below 50-level, indicating another bearish signal.
Looking to buy or trade Bitcoin (BTC) now? Invest at eToro!
68% of retail investor accounts lose money when trading CFDs with this provider
Read more:
Credit: Source link


")


 Bitcoin
  Ethereum
  Tether
  BNB
BNB  Solana
  USDC
USDC  XRP
XRP  Dogecoin
  Toncoin
  Cardano
  Shiba Inu
  Avalanche
  Wrapped Bitcoin
  Bitcoin Cash
  Polkadot
  NEAR Protocol
  Polygon
  Litecoin
  Uniswap
  LEO Token
  First Digital USD
  Aptos
Aptos  Hedera
  Filecoin
  Stellar
  Cosmos Hub
  XT.com
  Pepe
Pepe  OKB
OKB  Immutable
  Render
  Arbitrum
  dogwifhat
  Wrapped eETH
  Bittensor
  Optimism
  Maker
Maker  The Graph
