
Bitcoin Price Prediction – March 24
There have been several featuring variant movements upward and downward in the BTC/USD market operations as the crypto-economic price holds around $42,500 line. The US Dollar has succumbed to a force, letting the crypto trade between $43,487 and $42,648 value-lines at a minute positive percentage of 0.39.
BTC/USD Market
Key Levels:
Resistance levels: $45,000, $47,500, $50,000
Support levels: $40,000, $37,500, $35,000
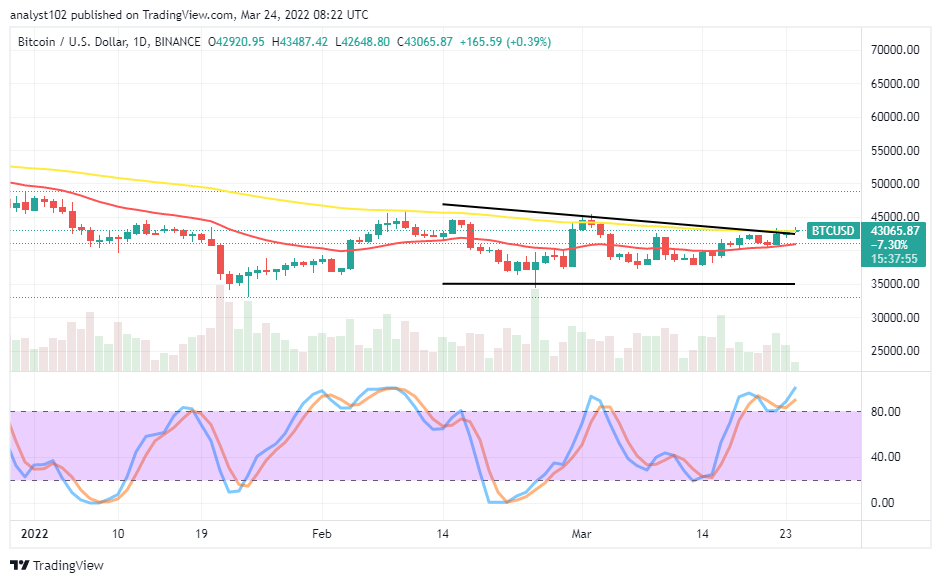 BTC/USD – Daily Chart
The BTC/USD daily chart shows the crypto-economic price holds around a $42,500 trading level. A slight push against a psychological point marked up for a force retardation upward-moving process has made. The Stochastic Oscillators are in the overbought region, seemingly trying to stage a consolidation moving style within. It appears somewhat that some ups can steal features for a while.
Can there be sustainable ups in the BTC/USD market operations as the crypto-economic price holds around $42,500 level?
It may not be easy to achieve sustainable ups past the higher resistance level at $45,000 as the BTC/USD market price holds briefly above the $42,500. Buyers may have to continually push based on the support that March 22nd bullish candlestick form a bit over the $40,000. However, the forces to the north side have been showing a weaker sign of moving more beneath the higher point mentioned earlier.
On the downside of the technical analysis, the BTC/USD market sellers currently have the potentiality of getting decent sell entry around the $42,500 provided that the higher resistance level-point at $45,000 isn’t breached out fearfully for a sustainable position. Price has to satisfy some of the upward forces left-over for bulls’ motion to exhaust around those value-lines.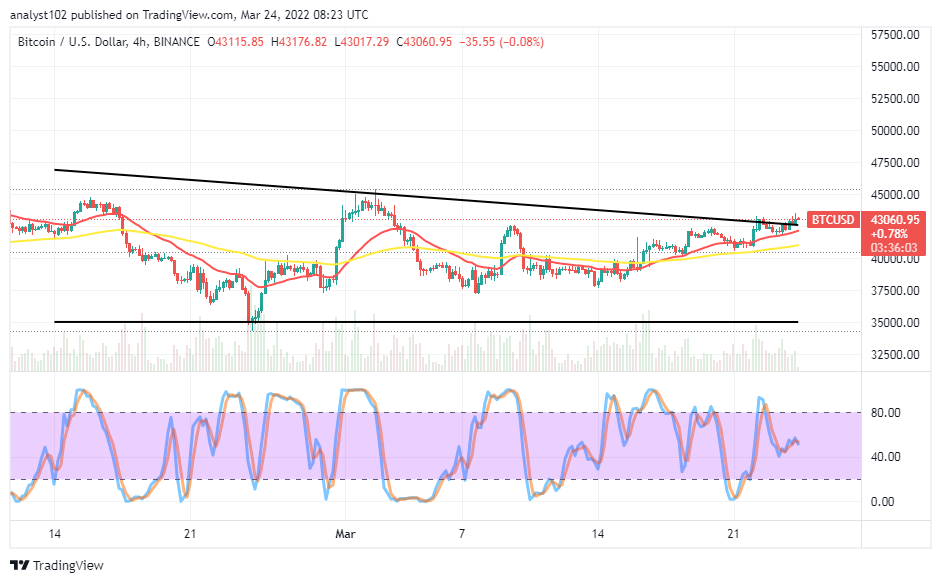
BTC/USD 4-hour Chart
The BTC/USD medium-term chart shows the crypto-economic price holds around a $42,500 trading level. The market appears tempting to push higher past the value-line to touch higher resistance points beneath the $45,000 resistance level. The 14-day SMA indicator has slightly crossed northward against the 50-day SMA indicator. The Stochastic Oscillators have moved down into the ranges of 80 and 40. And they are trying to point southbound closely above the smaller range-line to showcase that a falling force may return soon in the crypto economy.
Looking to buy or trade Bitcoin (BTC) now? Invest at eToro!

68% of retail investor accounts lose money when trading CFDs with this provider.
Read more:
Credit: Source link


 Profits Expands Portfolio with Two Utility Coins")


 Bitcoin
  Ethereum
  Tether
  BNB
BNB  Solana
  USDC
USDC  XRP
XRP  Dogecoin
  Toncoin
  Cardano
  Shiba Inu
  Avalanche
  Wrapped Bitcoin
  Bitcoin Cash
  Polkadot
  Polygon
  Litecoin
  NEAR Protocol
  Uniswap
  LEO Token
  Aptos
Aptos  First Digital USD
  Filecoin
  OKB
OKB  Stellar
  Cosmos Hub
  Render
  Arbitrum
  Bittensor
  Immutable
  dogwifhat
  Hedera
  Maker
Maker  Injective
  The Graph
  Optimism
  Ethena USDe
  Wrapped eETH
