
Bitcoin Price Prediction – March 28
The Bitcoin price prediction gains 1.49% as bulls keep working hard to nurture a bullish trend from the support at $45,000.
BTC/USD Long-term Trend: Ranging (Daily Chart)
Key levels:
Resistance Levels: $52,000, $54,000, $56,000
Support Levels: $43,000, $41,000, $39,000
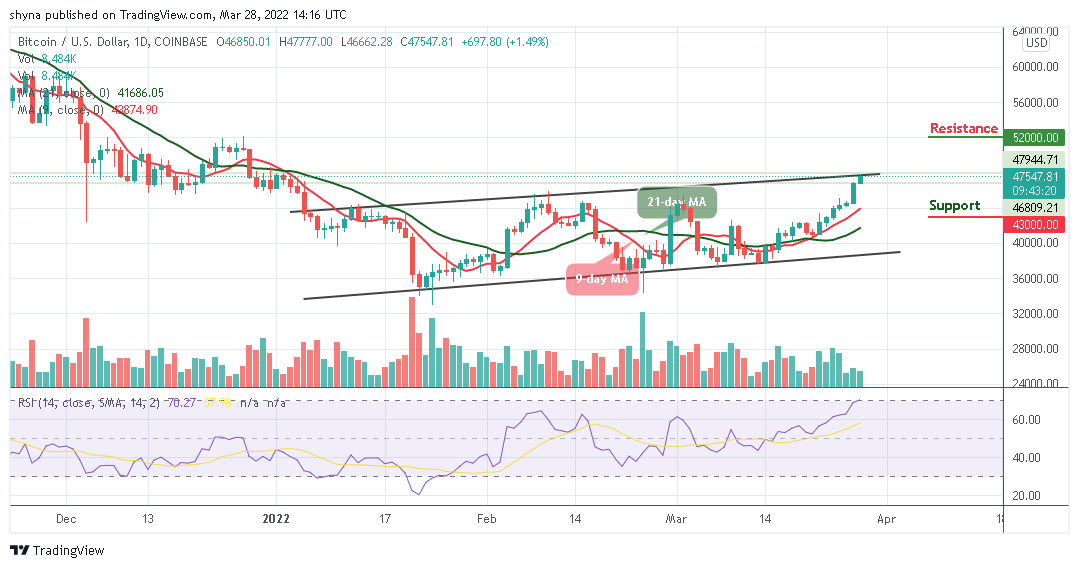
BTC/USD is currently trading at the $47,547 resistance level. The market price is trading above the 9-day moving average, indicating an upward movement in cryptocurrency. For the past few days, the Bitcoin price has been moving towards the north.
Bitcoin Price Prediction: Will BTC Break Above $50,000 Resistance Level or Reverse?
According to the daily chart, if the Bitcoin price retains the upward movement above the 9-day and 21-day moving averages, it is likely for the market price to touch the $50,000 level. This is where traders should expect buyers to fight for a further rise in BTC/USD and further development of the bullish trend. However, the purpose of this movement is to provide a level of resistance close to $48,000 as the technical indicator Relative Strength Index (14) moves to cross into the overbought region.
Looking at the price movement, there is likely that BTC/USD experiences a quick retracement or sell-off just in case it touches the crucial $45,000 level but if not; traders may see additional resistance levels of $52,000, $54,000, and $56,000 respectively. On the downside, if the market decides to fall, the price of Bitcoin could fall below the 9-day MA at $44,000, and if that support fails to hold the sell-off, BTC/USD could see a further decline towards the support levels of $43,000, $41,000, and $39,000.

BTC/USD Medium-Term Trend: Bullish (4H Chart)
On the 4-hour chart, BTC/USD is well and truly in the overbought region but that doesn’t seem to be impacting the momentum much, which implies hype and greed may be fuelling this rise as opposed to technical factors. Because of this, prices may fall as sharply as they have risen if the coin shows any weakness at the $48,000 resistance level.
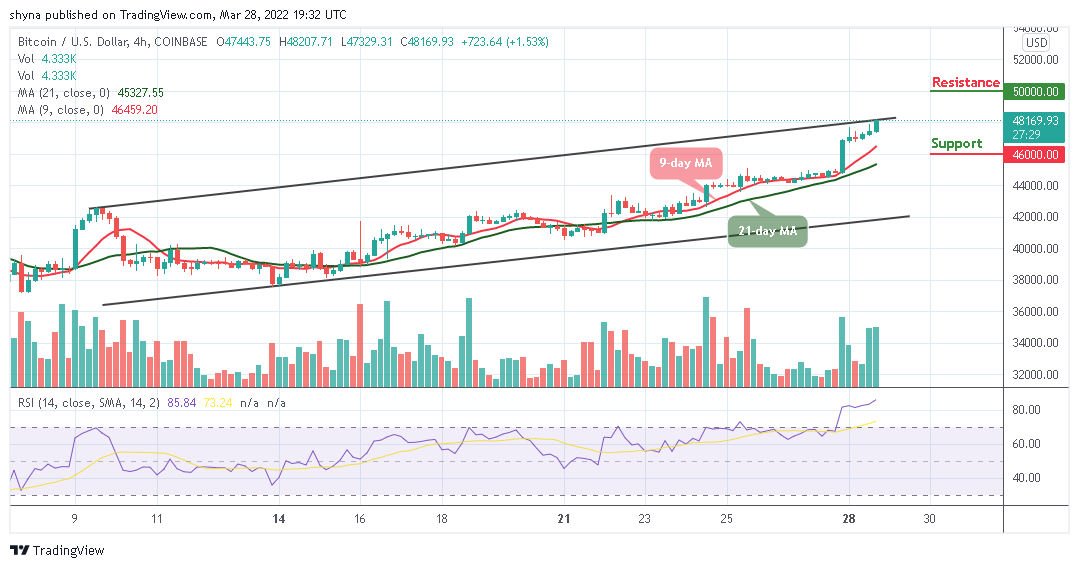
According to the Relative Strength Index (14), traders may experience a trend reversal as the Bitcoin (BTC) may break below the 9-day moving average and start printing consecutive higher lows. More so, BTC/USD is currently in the middle of a consolidation, preparing for the next move. Breaking above the channel may push it to the potential resistance levels at $50,000 and above while the support could be located at $46,000 and below.
Looking to buy or trade Bitcoin (BTC) now? Invest at eToro!
68% of retail investor accounts lose money when trading CFDs with this provider
Read more:
Credit: Source link


 Bitcoin
  Ethereum
  Tether
  BNB
BNB  Solana
  USDC
USDC  XRP
XRP  Dogecoin
  Toncoin
  Cardano
  Shiba Inu
  Avalanche
  Wrapped Bitcoin
  Bitcoin Cash
  Polkadot
  NEAR Protocol
  Polygon
  Litecoin
  Uniswap
  LEO Token
  First Digital USD
  Hedera
  Aptos
Aptos  Stellar
  Cosmos Hub
  OKB
OKB  Filecoin
  Render
  Immutable
  dogwifhat
  Pepe
Pepe  Bittensor
  XT.com
  Arbitrum
  Maker
Maker  The Graph
  Optimism
  Wrapped eETH
