
Bitcoin Price Prediction – February 27
The Bitcoin price prediction shows that BTC is falling below the moving averages as it trades around the $38,248 level.
BTC/USD Long-term Trend: Bearish (Daily Chart)
Key levels:
Resistance Levels: $44,000, $46,000, $48,000
Support Levels: $34,000, $32,000, $30,000
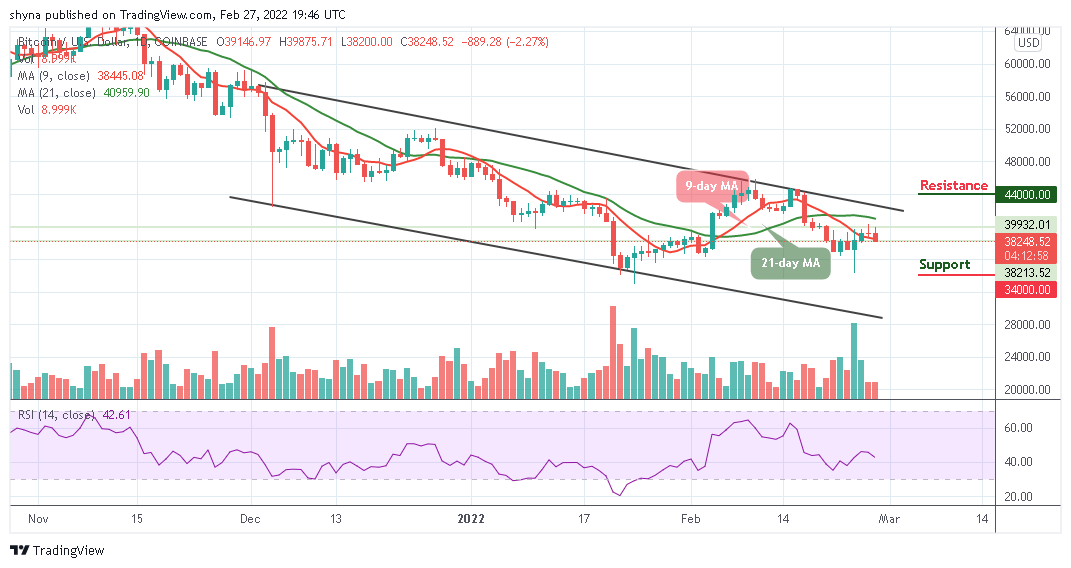
The daily chart reveals that BTC/USD begins to move downward within the descending channel with the current consolidation pattern. However, the coin fails to close above the $39,875 level as it may likely see a sharp drop towards the lower boundary of the channel. Meanwhile, the first support level may be located at $35,000. Beneath this, other supports lie at $34,000, $32,000, and $30,000.
Bitcoin Price Prediction: Would Bitcoin (BTC) Break Above $40k?
As the daily chart reveals, the Bitcoin price could not break above the resistance level at $39,875, the coin may set up another few days of negative price declines beneath $38,000. A break above the previous level would have set Bitcoin up to retest the $40,000 level, but the technical indicator Relative Strength Index (14) may cross below 40-level to add more bearish movements.
At the time of writing, traders can see that the Bitcoin price breaks below the 9-day moving average to gain more downtrends. More so, the Bitcoin price touches $39,875 but now dropping beneath the support level of $38,500. However, it does look that bears may end up closing below this support, but any movement towards the upside may hit resistance levels of $44,000, $46,000, and $48,000.

BTC/USD Medium-Term Trend: Bearish (4H Chart)
The 4-hour chart shows that the Bitcoin bears are now stepping back into the market pushing the BTC price below its previous support level that existed around $37,800. Although the Bitcoin price has not yet slipped below $37,500, it’s still in the loop of making a bounce back.
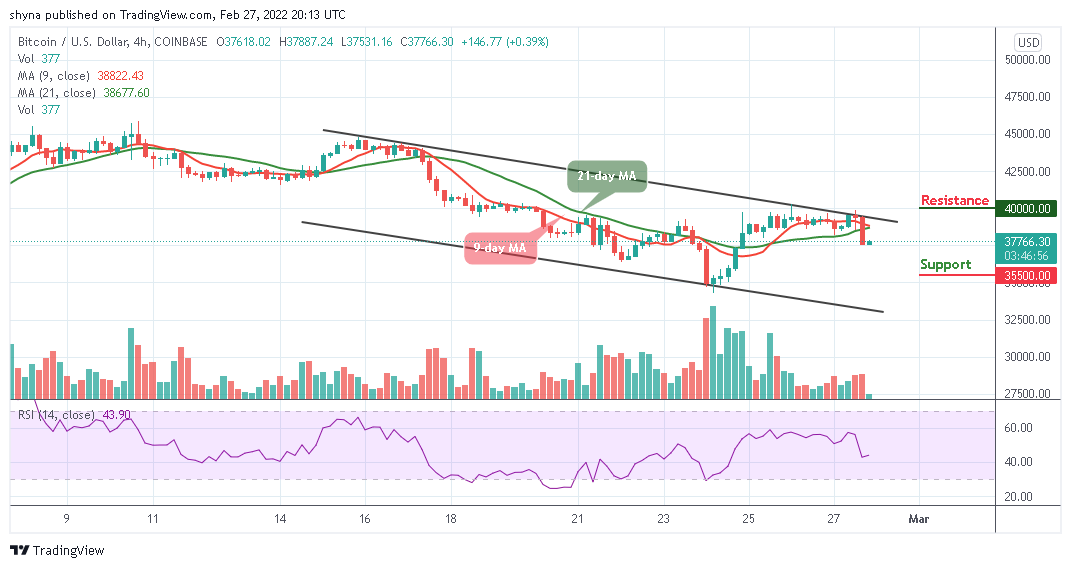
Now, BTC/USD is currently moving below the 9-day and 21-day moving averages. The upward movement may likely push the price nearest resistance at $40,000 and above while the immediate support lies at $35,500 and below. The technical indicator Relative Strength Index (14) is moving above 40-level, which indicates that the market may move sideways.
Looking to buy or trade Bitcoin (BTC) now? Invest at eToro!
68% of retail investor accounts lose money when trading CFDs with this provider
Read more:
Credit: Source link


")
 Guide")


, Nike (NYSE:NKE)")


 Bitcoin
  Ethereum
  Tether
  BNB
BNB  Solana
  USDC
USDC  XRP
XRP  Dogecoin
  Toncoin
  Cardano
  Shiba Inu
  Avalanche
  Wrapped Bitcoin
  Polkadot
  Bitcoin Cash
  NEAR Protocol
  Polygon
  Litecoin
  Uniswap
  LEO Token
  Aptos
Aptos  First Digital USD
  Render
  Filecoin
  Immutable
  Cosmos Hub
  Bittensor
  Stellar
  OKB
OKB  Hedera
  Arbitrum
  XT.com
  Pepe
Pepe  dogwifhat
  The Graph
  Maker
Maker  Optimism
  Fetch.ai
