
Bitcoin Price Prediction – March 26
The Bitcoin price shows weakness at $42,500, but this crucial technical formation could elevate it above $45,000 resistance.
BTC/USD Long-term Trend: Ranging (Daily Chart)
Key levels:
Resistance Levels: $49,000, $51,000, $53,000
Support Levels: $40,000, $38,000, $36,000
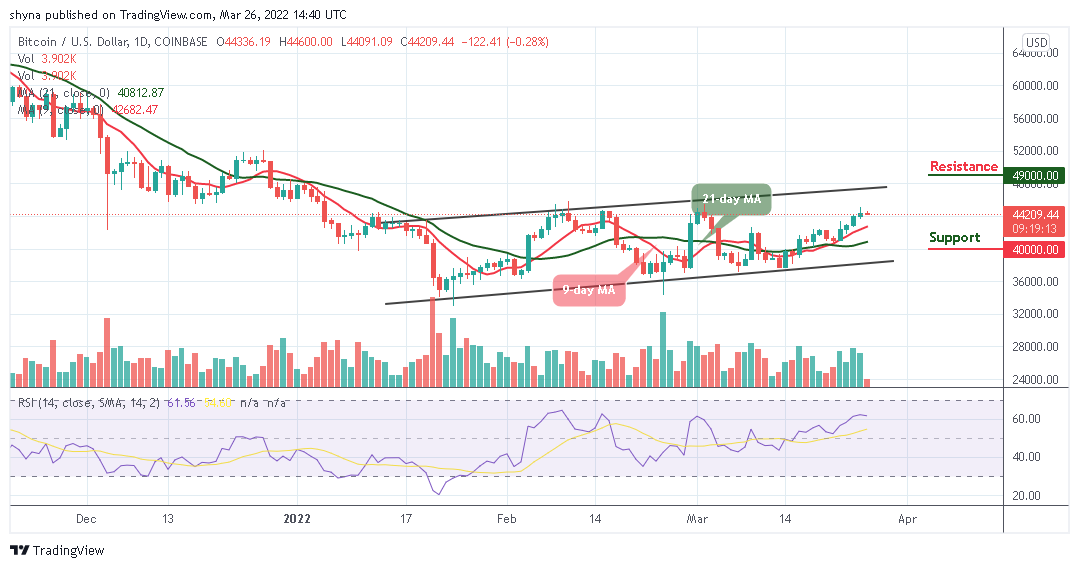
In the last couple of days, BTC/USD stalled under $44,000. On the downside, immense support between $43,000 and $41,000 has ensured the bearish leg does not stretch further as the Bitcoin price has been pivotal at $44,000 causing it not to be able to make progress above this critical level. Meanwhile, Bitcoin (BTC) has been working on a recovery mission with a support level of $43,000.
Bitcoin Price Prediction: Where Would Bitcoin Go Next?
The Bitcoin price is moving above the crucial level of $44,000 which may now function as the support zone in the event a reversal occurs. Meanwhile, on the upside, as the coin moves toward the north, little is in place to prevent correction targeting the key resistance of $45,000 as the technical indicator Relative Strength Index (14) moves above 60-level.
However, as the daily chart reveals, BTC/USD is banking on the support at $44,000 and $46,000 to ensure that despite a reversal, the Bitcoin price stays above the $42,000 level. Moreover, if the coin continues to trade above the 9-day and 21-day moving averages, crossing above the upper boundary of the channel may likely push it to the resistance levels at $49,000, $51,000, and $53,000 while crossing below the lower boundary of the channel could locate the supports at $40,000, $38,000, and $36,000 respectively.

BTC/USD Medium – Term Trend: Ranging (4H Chart)
The 4-hour chart shows that the price may likely head to the downside as the Relative Strength Index (14) moves to cross below 60-level. Although, the bears are trying to come back into the market; it is high time for the bulls to defend the $44,000 support and push the price towards the north.
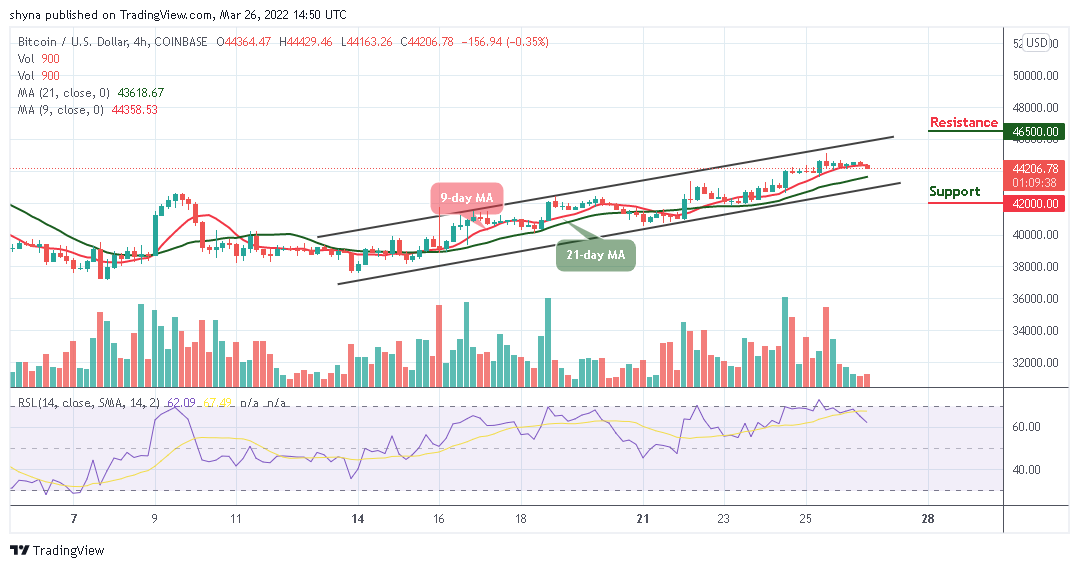
Meanwhile, the support level of $42,000 and below may come into play if the price breaks below the lower boundary of the channel. But in as much as the red-line of 9-day MA remains above the green-line 21-day MA; the market may continue to follow the upward trend, and if the technical indicator RSI (14) crosses above 70-level, it could touch the resistance level of $46,500 and above.
Looking to buy or trade Bitcoin (BTC) now? Invest at eToro!
68% of retail investor accounts lose money when trading CFDs with this provider
Read more:
Credit: Source link


 Bitcoin
  Ethereum
  Tether
  BNB
BNB  Solana
  USDC
USDC  XRP
XRP  Toncoin
  Dogecoin
  Cardano
  Shiba Inu
  Avalanche
  Wrapped Bitcoin
  Bitcoin Cash
  Polkadot
  Polygon
  Litecoin
  NEAR Protocol
  LEO Token
  Uniswap
  Aptos
Aptos  First Digital USD
  OKB
OKB  Filecoin
  Cosmos Hub
  Stellar
  Bittensor
  Arbitrum
  Render
  Hedera
  Maker
Maker  Immutable
  dogwifhat
  Injective
  Ethena USDe
  The Graph
  Optimism
  Wrapped eETH
  Fetch.ai
