
Join Our Telegram channel to stay up to date on breaking news coverage
The Bitcoin price prediction is showing positive signs, and it is likely to accelerate further higher in the near term.
Bitcoin Prediction Statistics Data:
- Bitcoin price now – $16,833
- Bitcoin market cap – $323.9 billion
- Bitcoin circulating supply – 19.2 million
- Bitcoin total supply – 19.2 million
- Bitcoin Coinmarketcap ranking – #1
BTC/USD Long-term Trend: Bearish (Daily Chart)
Key levels:
Resistance Levels: $20,000, $22,000, $24,000
Support Levels: $14,000, $12,000, $10,000
BTC/USD is attempting an upside break above $17,000 and it could start a steady recovery if it clears the $17,000 and $17,200 resistance levels. The king coin is likely to cross above the 9-day and 21-day moving averages.
Bitcoin Price Prediction: Where Could Bitcoin Price Go Next?
At the moment, the Bitcoin price is likely to move towards the upper boundary of the channel as the price could establish a new bullish signal. At the moment, one could say that the long-term outlook could favor the bulls, which may hit the potential resistance levels at $20,000, $22,000, and $24,000 respectively.
However, any drop from the current level could lead to declines in the critical support below the 9-day and 21-day moving averages. However, in case BTC drops and touches the low of $16,500 support, then the coin can rely on the long-term support levels at $14,000, $12,000, and $10,000. Moreover, the technical indicator Relative Strength Index (14) is likely to cross above the 50-level, which could indicate more bullish signals.
BTC/USD Medium-term Trend: Ranging (4H Chart)
According to the 4-hour chart, the Bitcoin price is seen hovering above the 9-day and 21-day moving averages at $16,832. However, the king coin may need to cross above the upper boundary of the channel to reach the resistance level of $17,000. Moreover, BTC/USD could maintain its bull run above this level. The technical indicator Relative Strength Index (14) is likely to cross below the 50-level.
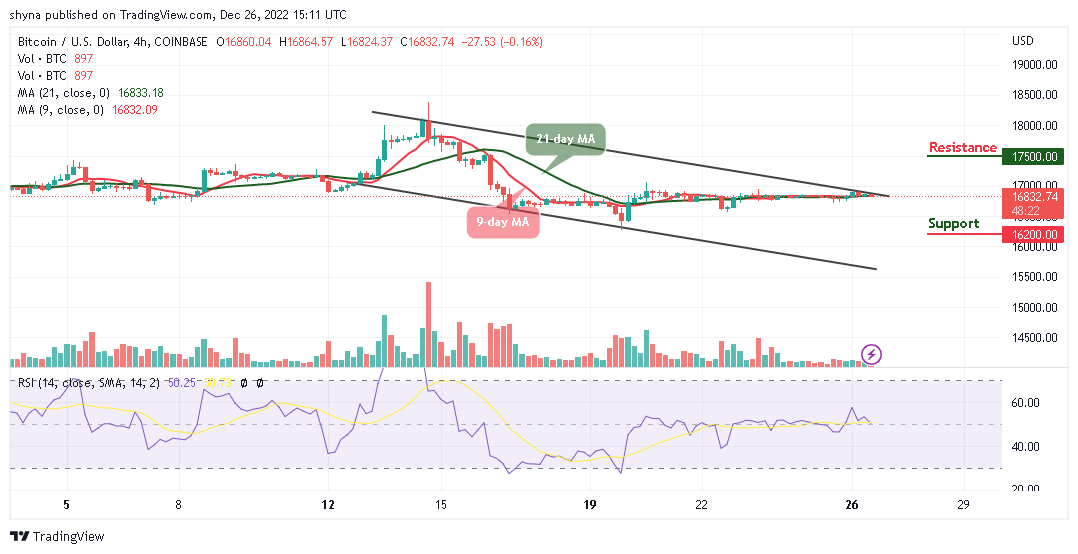
However, BTC may take a downward move if the bulls failed to push the price higher, and the coin may breach below the 9-day and 21-day moving averages, which could reach another support at $16,200 and below. Nevertheless, if the bulls find a decent resistance level of around $17,000, the coin may move bullishly above the channel to hit the resistance level of $17,500 and above.
Dash 2 Trade gives you the ability to optimize your trading and speculative profitability with effective crypto trading recommendations, auto trading, and analytics features. There is a D2T token presale ongoing and time is running out. The presale dashboard launch is coming soon since the product dev is ahead of the schedule. So far, the presale has raised almost $11 million.
Related
Dash 2 Trade – High Potential Presale
- Active Presale Live Now – dash2trade.com
- Featured in Cointelegraph – $10M Raised
- KYC Verified & Audited
- Native Token of Crypto Signals Ecosystem
Join Our Telegram channel to stay up to date on breaking news coverage
Credit: Source link


")


 Bitcoin
  Ethereum
  Tether
  BNB
BNB  Solana
  USDC
USDC  XRP
XRP  Dogecoin
  Toncoin
  Cardano
  Shiba Inu
  Avalanche
  Wrapped Bitcoin
  Bitcoin Cash
  Polkadot
  Polygon
  Litecoin
  NEAR Protocol
  LEO Token
  Uniswap
  First Digital USD
  Aptos
Aptos  OKB
OKB  Filecoin
  Cosmos Hub
  Bittensor
  Render
  Stellar
  Arbitrum
  Maker
Maker  Hedera
  Immutable
  dogwifhat
  Ethena USDe
  The Graph
  Optimism
  Wrapped eETH
  Injective
  Pepe
Pepe 
