
Bitcoin Price Prediction – March 6
At the time of writing, the Bitcoin price prediction is dropping over 1.60% within 24 hours as it trades at the $38,773 level.
BTC/USD Long-term Trend: Bearish (Daily Chart)
Key levels:
Resistance Levels: $45,000, $47,000, $49,000
Support Levels: $34,000, $32,000, $30,000
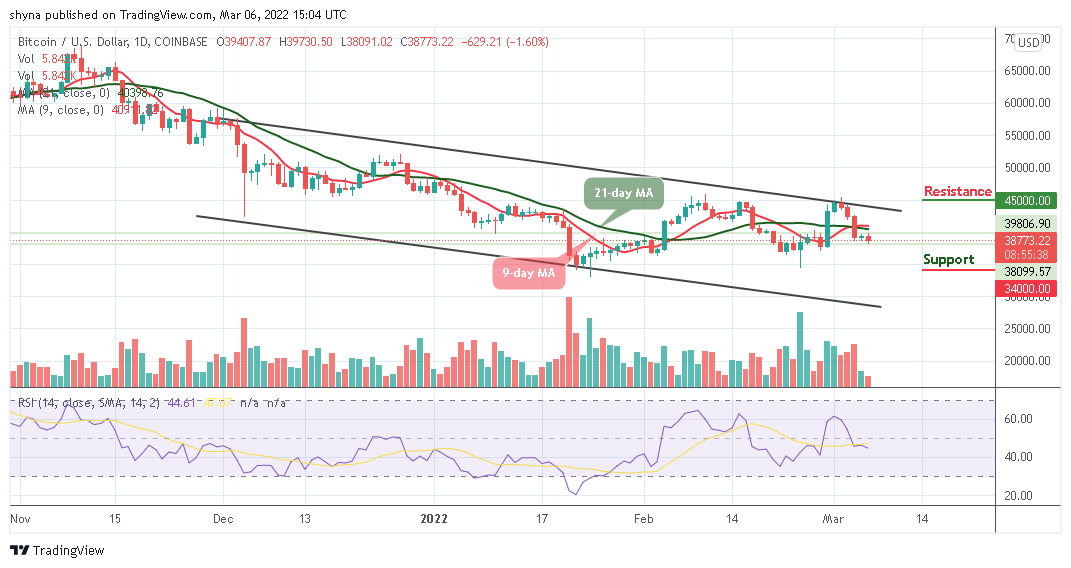
The daily chart reveals that BTC/USD failed to break above the previous resistance level of $39,000. Moreover, the Bitcoin (BTC) begins the day off by trending lower towards the support level of $38,000 below the 9-day and 21-day moving averages. However, the first support level is located at $38,000. Beneath this, support lies at $34,000, $32,000, and $30,000 levels.
Bitcoin Price Prediction: Bitcoin (BTC) May Consolidate to the Downside
Today’s trading marks another day that the Bitcoin price fails to stay above the moving averages as it looks to set up another few days of negative price declines beneath $38,500. Meanwhile, a break above the opening price of $39,407 would have set the first digital asset up to reach the nearest resistance at the $40,000 level. In other words, traders can see Bitcoin fails to break up as the technical indicator Relative Strength Index (14) is facing the downside.
Nevertheless, the Bitcoin price couldn’t go higher as it is seen dropping towards the lower boundary of the channel. More so, should the technical indicator moves below 40-level, the market price may end within the negative side, but on the contrary, moving towards the upside could meet the resistance levels at $45,000, $47,000, and $49,000.

BTC/USD Medium-Term Trend: Ranging (4H Chart)
Looking at the 4-hour chart, the bulls are coming back into the market as the coin moves to cross above the 9-day moving average. However, if the bulls put more pressure, the Bitcoin price my hit the resistance level of $43,000 and above.

However, if the sellers bring the current market value downward, traders may expect a slide below the lower boundary of the channel; breaking this barrier may further allow the coin to hit the support at $36,000 and below. At the moment, the technical indicator Relative Strength Index (14) is moving to cross above 40-level which could give additional bullish signals shortly.
Looking to buy or trade Bitcoin (BTC) now? Invest at eToro!
68% of retail investor accounts lose money when trading CFDs with this provider
Read more:
Credit: Source link


 Bitcoin
  Ethereum
  Tether
  BNB
BNB  Solana
  USDC
USDC  XRP
XRP  Toncoin
  Dogecoin
  Cardano
  Shiba Inu
  Avalanche
  Wrapped Bitcoin
  Bitcoin Cash
  Polkadot
  Polygon
  Litecoin
  NEAR Protocol
  Uniswap
  LEO Token
  Aptos
Aptos  First Digital USD
  OKB
OKB  Cosmos Hub
  Stellar
  Filecoin
  Bittensor
  Arbitrum
  Render
  Hedera
  Immutable
  Maker
Maker  dogwifhat
  Injective
  Ethena USDe
  The Graph
  Optimism
  Wrapped eETH
