
Join Our Telegram channel to stay up to date on breaking news coverage
The Bitcoin price prediction has been facing some mixed price action in recent days, with the crypto seeing multiple strong uptrends and selloffs.
Bitcoin Prediction Statistics Data:
- Bitcoin price now – $24,818
- Bitcoin market cap – $479.6 billion
- Bitcoin circulating supply – 19.2 million
- Bitcoin total supply – 19.2 million
- Bitcoin Coinmarketcap ranking – #1
BTC/USD Long-term Trend: Bullish (Daily Chart)
Key levels:
Resistance Levels: $28,000, $29,000, $30,000
Support Levels: $21,000, $20,000, $19,000
At the time of writing, BTC/USD is trading up just above 2.17% at its current price of $24,818, which marks a notable surge from recent lows of $23,865 that were set in the early hours of today. However, the king coin’s strength is showing few signs of degrading, with bulls aggressively buying each dip as bears struggle to gain any momentum. Meanwhile, where the crypto trends in the mid-term will undoubtedly depend largely on whether or not it can break above $25,000.
Bitcoin Price Prediction: What to Expect from Bitcoin (BTC)
At the time of writing, the Bitcoin price is moving marginally at its current price of $24,818. Although this marks a meaningful climb from the opening price of $24,219.62, it is important to note that this could mark a bull-favoring break above the upper boundary of the channel.
Meanwhile, as the technical indicator Relative Strength Index (14) faces the north, a sustainable move above the 60-level could locate the nearest resistance of $26,000, reaching this may allow for an extended recovery towards $28,000, $29,000, and $30,000 respectively. On the contrary, any bearish movement towards the lower boundary of the channel may force the Bitcoin price to hit the supports at $21,000, $20,000, and $19,000.
BTC/USD Medium-term Trend: Ranging (4H Chart)
According to the 4-hour chart, BTC/USD should recover above the 9-day and 21-day moving averages to mitigate any short-term bearish pressure and allow for an extended recovery toward $25,500. A higher resistance may be found at $26,500 and above.
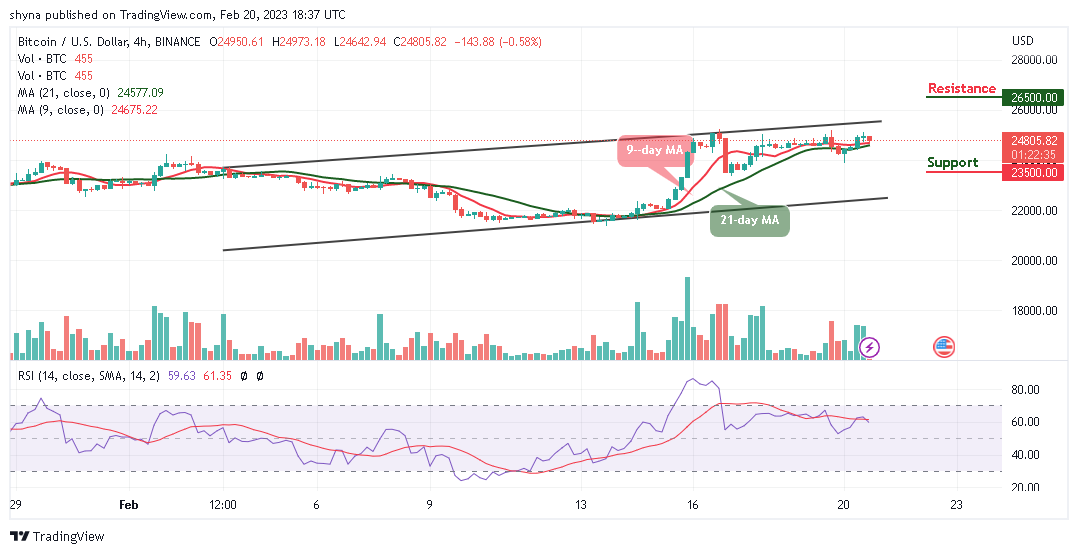
In contrast, the nearest support is located at $24,000, and a sustainable move below this level may increase the downside pressure and push the price toward the support level of $23,500 and below. Considering that the technical indicator Relative Strength Index (14) could revert to the upside, therefore, traders might expect that more bullish signals are coming into focus.
Bitcoin Alternatives
Looking at the daily chart, the Bitcoin price is trading comfortably towards the upper boundary of the channel as the price establishes a new bullish signal. However, one could say that the long-term outlook could favor the bulls if the coin gains an additional uptrend. Meanwhile, Fight Out is groundbreaking because it integrates cryptocurrencies with fitness and modern thinking that makes use of cell phones. Therefore, it is obvious that FGHT is a much better investment since it provides many more opportunities for earning as about $5m has been raised in the presale so far.
Fight Out (FGHT) – Move to Earn in the Metaverse

- CertiK audited & CoinSniper KYC Verified
- Early Stage Presale Live Now
- Earn Free Crypto & Meet Fitness Goals
- LBank Labs Project
- Partnered with Transak, Block Media
- Staking Rewards & Bonuses
Join Our Telegram channel to stay up to date on breaking news coverage
Credit: Source link


 Bitcoin
  Ethereum
  Tether
  BNB
BNB  Solana
  USDC
USDC  XRP
XRP  Dogecoin
  Toncoin
  Cardano
  Avalanche
  Shiba Inu
  Wrapped Bitcoin
  Bitcoin Cash
  Polkadot
  Polygon
  NEAR Protocol
  Litecoin
  LEO Token
  Uniswap
  Aptos
Aptos  First Digital USD
  OKB
OKB  Cosmos Hub
  Filecoin
  Stellar
  Arbitrum
  Bittensor
  Render
  Maker
Maker  Hedera
  Immutable
  dogwifhat
  Injective
  Ethena USDe
  The Graph
  Optimism
  Wrapped eETH
