
Bitcoin Price Prediction – February 14
The Bitcoin price prediction may begin to follow the sideways movement as the coin trades around the resistance level of $42,000.
BTC/USD Long-term Trend: Bearish (Daily Chart)
Key levels:
Resistance Levels: $48,000, $50,000, $52,000
Support Levels: $37,000, $35,000, $33,000
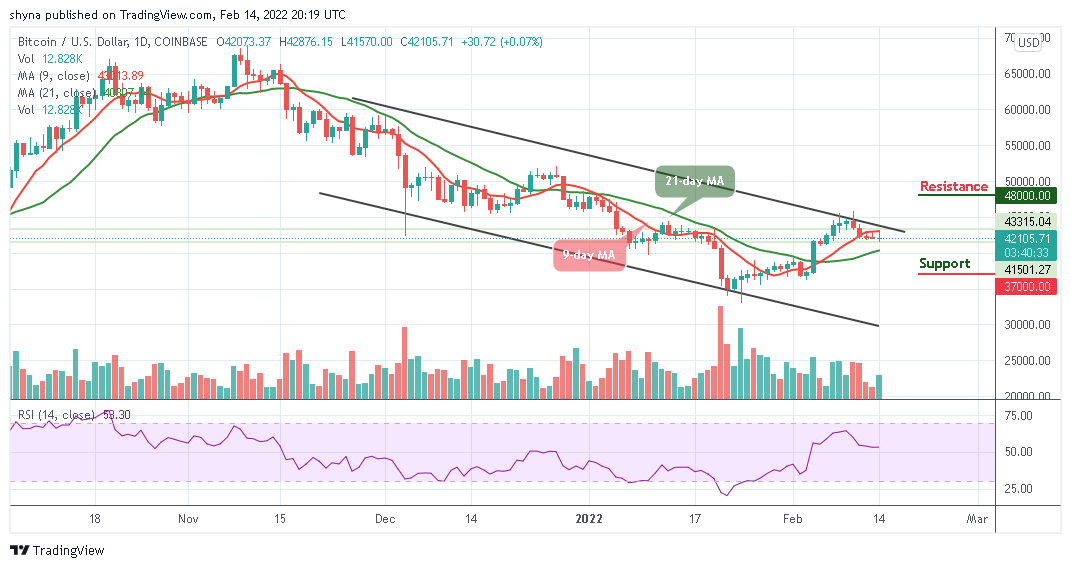
BTC/USD is likely to experience another unexpected selloff if the Bitcoin price crosses below the 21-day moving average. Today, the Bitcoin price drops slightly to touch the support of $41,570 after touching the daily high of $41,876. However, a reversal could play out if the king coin trades above the 9-day moving average, and this may send BTC/USD above the upper boundary of the channel.
Bitcoin Price Prediction: Bitcoin Price May Consolidate
The technical indicator Relative Strength Index (14) reveals that the Bitcoin price is consolidating above 50-level, and any drop below this level could lead the coin to cross below the 21-day moving averages. However, the technical indicator Relative Strength Index (14) may trade sideways as the signal line moves in the same direction above 50-level.
On the upside, recovery may not come now but any attempt to cross above the upper boundary of the channel could push the coin to the resistance levels of $48,000, $50,000, and $52,000 respectively. On the contrary, any bearish movement below the 21-day moving average may force the Bitcoin price to reach the support levels at $37,000, $35,000, and $33,000.

BTC/USD Medium-Term Trend: Ranging (4H Chart)
On the 4-hour chart, the Bitcoin price is hovering below the 9-day and 21-day moving averages. The chart reveals that the coin touches the support level of $42,002 as the market prepares to move sideways. However, BTC/USD is likely to follow the bearish movement if the coin crosses below the lower boundary of the channel. Therefore, critical support could be located at $40,000 and below.
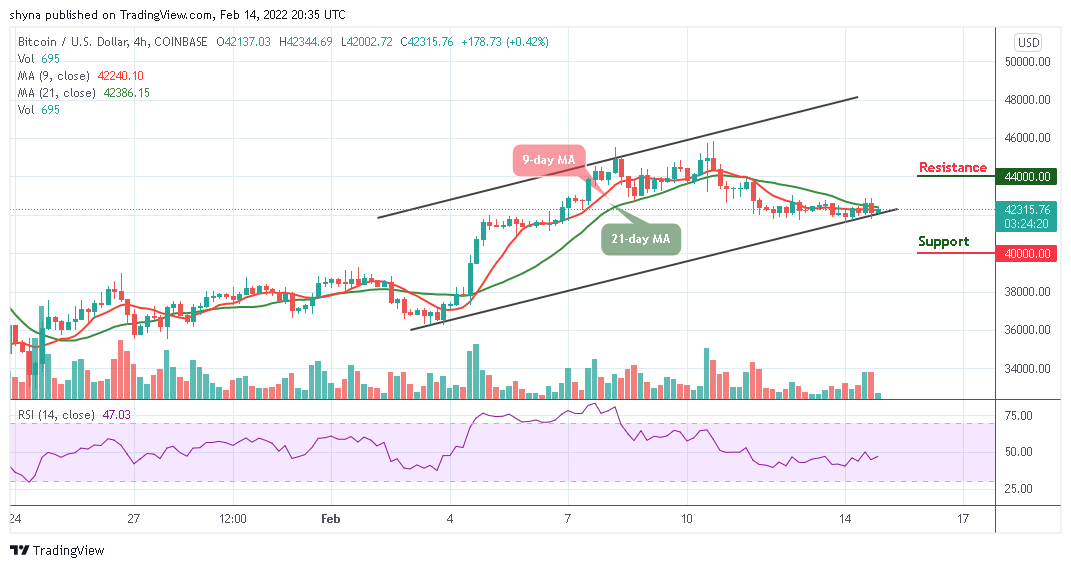
Moreover, if the price bounce back above the 9-day and 21-day moving averages and head to the upside, the Bitcoin price may reach the resistance level of $44,000 and above. Now, as the technical indicator Relative Strength Index (14) crosses above 50-level, the king coin is likely to experience a slight bullish movement.
Looking to buy or trade Bitcoin (BTC) now? Invest at eToro!
68% of retail investor accounts lose money when trading CFDs with this provider
Read more:
Credit: Source link


 and Ethereum (ETH) Down 6% as Seesaw Protocol (SSW) Soars 1000%")


 Bitcoin
  Ethereum
  Tether
  BNB
BNB  Solana
  USDC
USDC  XRP
XRP  Dogecoin
  Toncoin
  Cardano
  Shiba Inu
  Avalanche
  Wrapped Bitcoin
  Bitcoin Cash
  Polkadot
  Polygon
  Litecoin
  NEAR Protocol
  Uniswap
  LEO Token
  Aptos
Aptos  First Digital USD
  Filecoin
  OKB
OKB  Stellar
  Cosmos Hub
  Render
  Arbitrum
  Immutable
  dogwifhat
  Bittensor
  Hedera
  Maker
Maker  Injective
  The Graph
  Ethena USDe
  Optimism
  Wrapped eETH
