
Bitcoin Price Prediction – February 22
The Bitcoin price prediction shows BTC rebounding from the daily low of $36,350 as the buying interest may increase towards $40,000.
BTC/USD Long-term Trend: Bearish (Daily Chart)
Key levels:
Resistance Levels: $42,000, $44,000, $46,000
Support Levels: $32,000, $30,000, $28,000
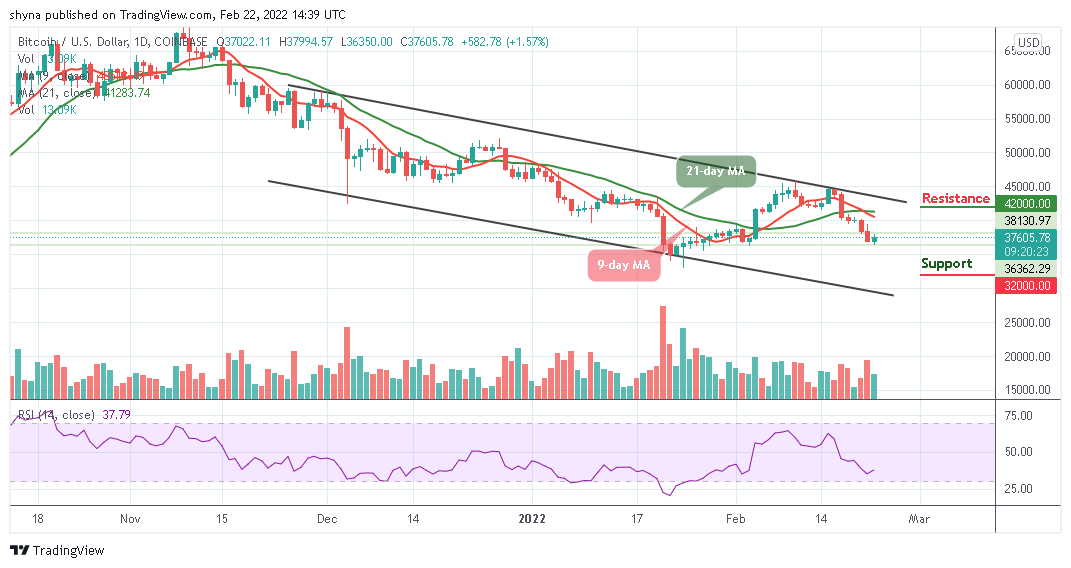
BTC/USD may continue to fall if the market price stays below the 9-day and 21-day moving averages. However, as the market establishes a move towards the resistance level of $38,000, the buyers may continue to look for additional resistance levels on their way to the 9-day moving average.
Bitcoin Price Prediction: BTC Price May Reclaim $40,000 Resistance
According to the daily chart, after the Bitcoin price begins the daily trade at $37,022, the king coin is now trading above the resistance level of $37,500 and looking forward to reclaiming more resistance levels. Moreover, the daily chart reveals that as the 9-day moving average is crossing below the 21-day moving average; it may confirm the next direction that the coin will follow. In other words, BTC/USD may decline if the price breaks toward the lower boundary of the channel, but it could rise if the $40,000 resistance is reached.
At the time of writing, the technical indicator Relative Strength Index (14) may likely cross above 40-level to indicate a bullish movement. Meanwhile, if the king coin crosses above the moving averages, it could reach the resistance levels of $42,000, $44,000, and $46,000 but any movement towards the lower boundary of the channel could hit the supports at $32,000, $30,000, and $28,000.

BTC/USD Medium-Term Trend: Bearish (4H Chart)
According to the 4-hour chart, the Bitcoin price is seen rising above the 9-day moving average as the technical indicator Relative Strength Index moves to cross above 40-level. However, if the Bitcoin price moves toward the upper boundary of the channel, the bullish influence could spike and the acquired more gains.

However, should in case the current candle fail to move bullishly, the Bitcoin price may slide towards the support level of $36,000 and below. Furthermore, the bulls may need to keep the coin above the resistance level of $38,000 in other to break the potential resistance at $40,000 and above.
Looking to buy or trade Bitcoin (BTC) now? Invest at eToro!
68% of retail investor accounts lose money when trading CFDs with this provider
Read more:
Credit: Source link


 Bitcoin
  Ethereum
  Tether
  BNB
BNB  Solana
  USDC
USDC  XRP
XRP  Dogecoin
  Toncoin
  Cardano
  Shiba Inu
  Avalanche
  Wrapped Bitcoin
  Bitcoin Cash
  Polkadot
  NEAR Protocol
  Polygon
  Litecoin
  Uniswap
  Hedera
  LEO Token
  Aptos
Aptos  First Digital USD
  Render
  Filecoin
  Stellar
  Immutable
  Cosmos Hub
  Pepe
Pepe  OKB
OKB  Bittensor
  dogwifhat
  Arbitrum
  XT.com
  The Graph
  Maker
Maker  Optimism
  Wrapped eETH