
Bitcoin Price Prediction – February 2
The Bitcoin price prediction resumes the decline after touching the daily high at $38,888, but the buying interest may increase on approach to $39,000.
BTC/USD Long-term Trend: Bearish (Daily Chart)
Key levels:
Resistance Levels: $44,000, $46,000, $48,000
Support Levels: $34,000, $32,000, $30,000
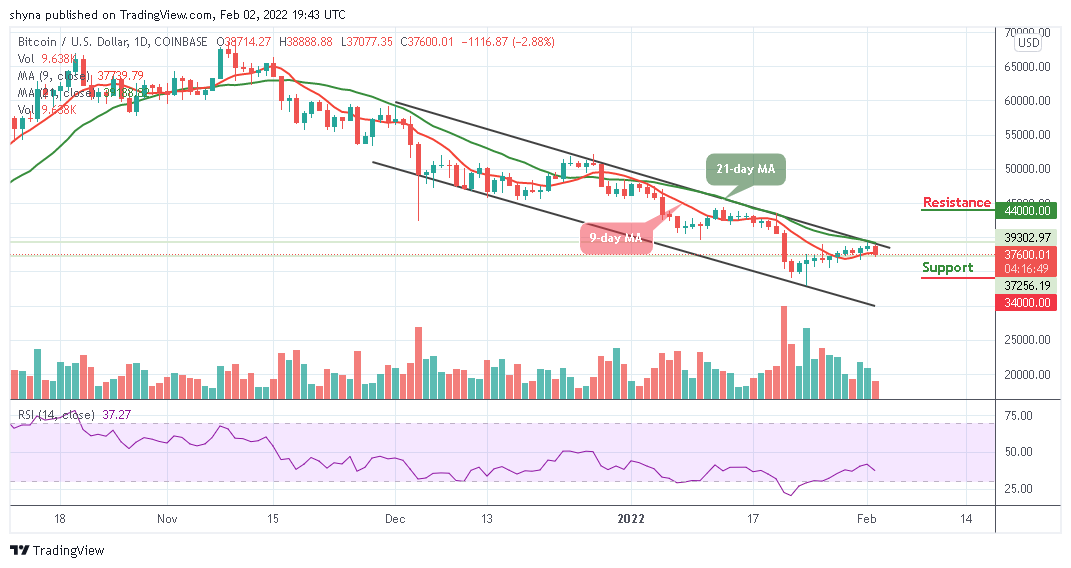
At the early hours of today, BTC/USD touches the high of $38,888 and now retreating below the 9-day moving average. The Bitcoin price has been moving sown slowly at the time of writing. Meanwhile, the psychological barrier of $38,000 still serves as the first important resistance within the market. More so, a sustainable move above this level may likely push the price towards the daily high at $39,500.
Bitcoin Price Prediction: BTC Price May Consolidate to the downside
On the intraday chart, the Bitcoin price breaks toward the downside, which may increase the selling pressure. At the time of writing, the price is hovering at the support level of $37,600 and if this is cleared, the sell-off may be extended to $35,000 which is below the 9-day moving average. However, the dips to $36,000 are likely to be bought, which means the overall bullish sentiments may prevail.
Moreover, if the price moves below the mentioned-support, $35,000 could come into focus which may serve as a support during the consolidation period while the critical supports could be located at $34,000, $32,000, and $30,000. On the upside, the first resistance may come at $40,000. Once it is clear, $42,000 could come back into focus. Further bullish movement may hit the potential resistance levels at $44,000, $46,000, and $48,000 as the Relative Strength Index (14) moves below 40-level.

BTC/USD Medium-Term Trend: Ranging (4H Chart)
BTC/USD on 4-hour chat is currently in the ascending range of the medium-term outlook. On the flip side, if $37,000 remains unconquered in the short term, bullish influence could spike. In this case, the accrued gains could be trimmed massively.
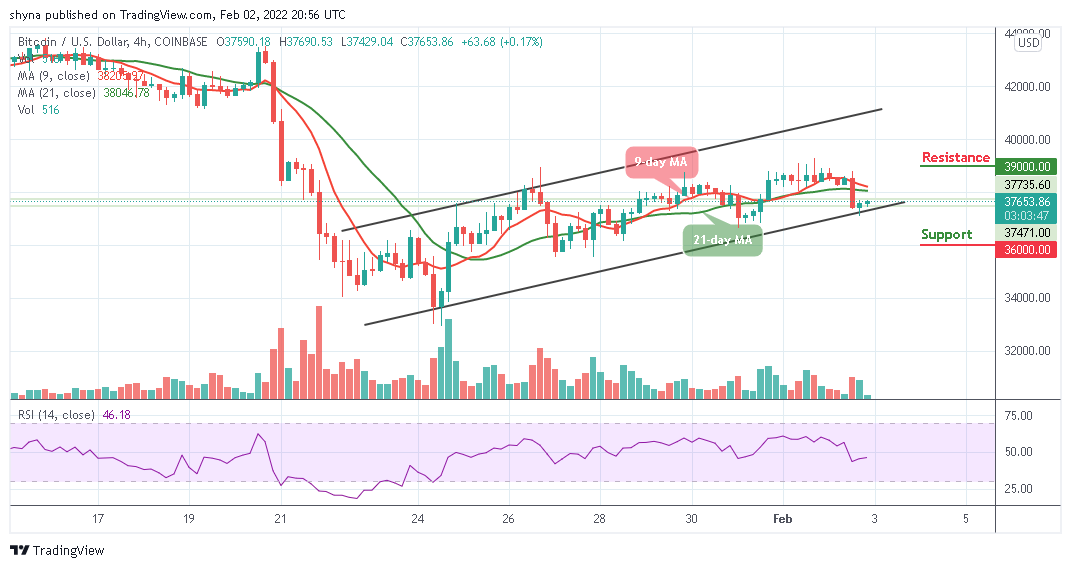
However, the forming rising pattern could jeopardize tentative support levels at $37,000, and $36,500. On the downside, the ultimate target is the support at $36,000, $34,000, and $32,000. For now, the best the bulls can do is to hold above the weak support at $37,500 and keep their attention on breaking the resistance at $39,000, $41,000, and $43,000 levels. Meanwhile, the Relative Strength Index (14) is likely to cross above 50-level, which may suggest more bullish signals.
Looking to buy or trade Bitcoin (BTC) now? Invest at eToro!
68% of retail investor accounts lose money when trading CFDs with this provider
Read more:
Credit: Source link


 Bitcoin
  Ethereum
  Tether
  BNB
BNB  Solana
  USDC
USDC  XRP
XRP  Dogecoin
  Toncoin
  Cardano
  Shiba Inu
  Avalanche
  Wrapped Bitcoin
  Bitcoin Cash
  Polkadot
  NEAR Protocol
  Polygon
  Litecoin
  Hedera
  Uniswap
  LEO Token
  Aptos
Aptos  First Digital USD
  Render
  Filecoin
  Stellar
  Immutable
  Cosmos Hub
  Pepe
Pepe  OKB
OKB  Bittensor
  dogwifhat
  Arbitrum
  XT.com
  The Graph
  Maker
Maker  Optimism
  Fetch.ai
