
Join Our Telegram channel to stay up to date on breaking news coverage
The dYdX price prediction shows that DYDX could follow a bullish movement if the market can attempt to back above the moving averages.
dYdX Prediction Statistics Data:
- dYdX price now – $2.73
- dYdX market cap – $425.1 million
- dYdX circulating supply – $156.2 million
- dYdX total supply – $1 billion
- dYdX Coinmarketcap ranking – #93
DYDX/USD Market
Key Levels:
Resistance levels: $4.0, $4.2, $4.4
Support levels: $1.5, $1.3, $1.1
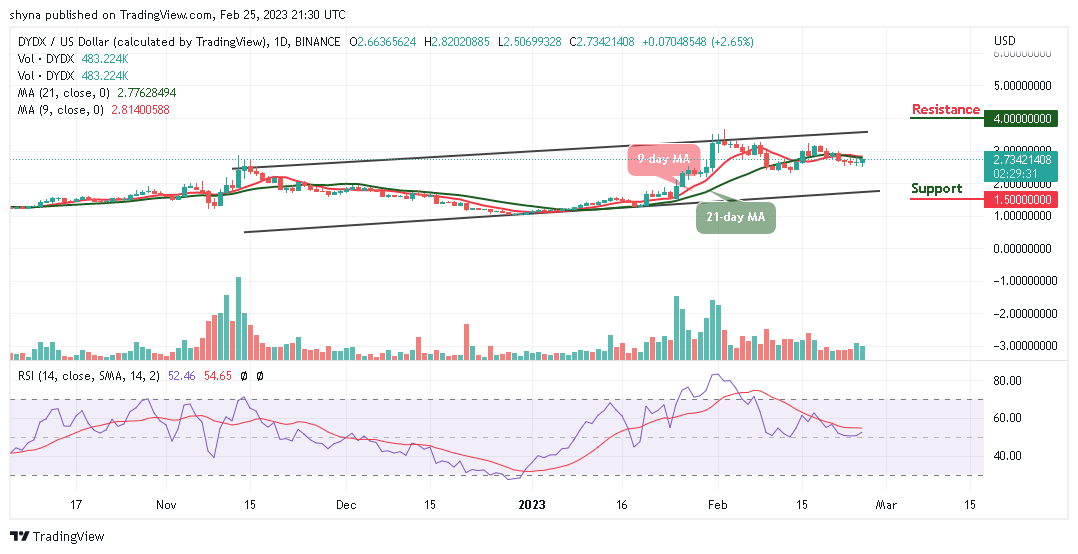
At the moment, DYDX/USD is likely to cross above the 9-day and 21-day moving averages, if the buyers could increase the buying pressure. For the fact that the coin is trading at $2.73, the dYdX price may continue to follow the bullish movement. Therefore, traders can expect the coin to cross above the moving averages to hit the nearest resistance level of $3.0.
dYdX Price Prediction: dYdX (DYDX) May Head to the Upside
If the dYdX price remains below the 9-day and 21-day moving averages, it could head toward the lower boundary of the channel, the market price could touch the previous support level of $2.5. But if the price moves to cross above the 21-day moving average, traders can then expect a bullish continuation towards the upside. Meanwhile, as the technical indicator, Relative Strength Index (14) is seen moving above the 50-level, if the coin crosses above the upper boundary of the channel, it could hit the resistance levels at $4.0, $4.2, and $4.4 respectively.
Moreover, if the coin can follow trade bullishly, traders may witness additional gains above the resistance level of $3.0. On the contrary, DYDX/USD can remain below the 9-day and 21-day moving averages, and, a bearish extension could roll the coin to the long-term support at $1.5, $1.3, and $1.1 levels.
When compares with Bitcoin, dYdX continues to follow the sideways movement as the coin remains below the 9-day and 21-day moving averages. In the case of a bullish movement, there is a need for an increasing volume and resistance to cause an upsurge in the market. At the moment, dYdX (DYDX) is trading at 1875 SAT. Meanwhile, if the coin heads toward the lower boundary of the channel, it could hit the support level at 750 SAT and below.
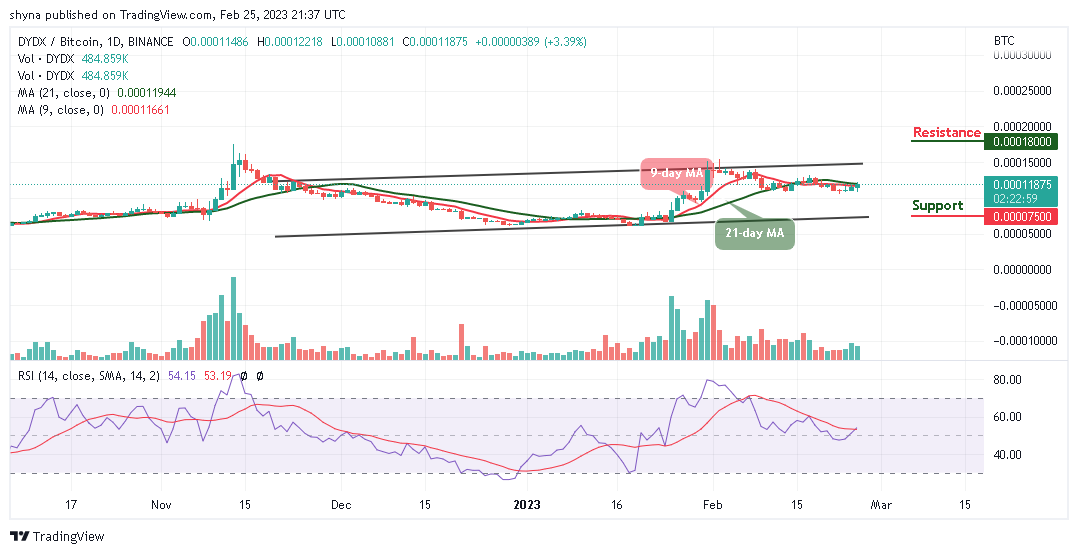
Nonetheless, if a bullish move occurs above the upper boundary of the channel; buyers can confirm a bull run for the coin as the closest resistance could be found at 1800 SAT and above. The technical indicator Relative Strength Index (14) is likely to cross above the 60-level, suggesting bullish movement.
dYdX Alternatives
The dYdX price prediction shows that the coin is getting ready for a bullish cross above the 9-day and 21-day moving averages, once this is done, it is likely for the coin to hit the resistance level of $3.0. Therefore, bulls may need to increase the buying pressure so as to push the dYdX price to the upside. Similarly, another crypto with more promising performance is the Fight Out token, the FGHT token presale is still on and this token has gathered nearly $5 million since the presale started. As a boost, this token team has declared up to a 67% presale bonus for any investors interested in the token and this is something nobody will like to miss.
Fight Out (FGHT) – Move to Earn in the Metaverse

- CertiK audited & CoinSniper KYC Verified
- Early Stage Presale Live Now
- Earn Free Crypto & Meet Fitness Goals
- LBank Labs Project
- Partnered with Transak, Block Media
- Staking Rewards & Bonuses
Join Our Telegram channel to stay up to date on breaking news coverage
Credit: Source link


 eyes a breakout as lawyer makes a prediction on Ripple case with SEC")


 Bitcoin
  Ethereum
  Tether
  BNB
BNB  Solana
  USDC
USDC  XRP
XRP  Toncoin
  Dogecoin
  Cardano
  Avalanche
  Shiba Inu
  Wrapped Bitcoin
  Bitcoin Cash
  Polkadot
  Polygon
  Litecoin
  LEO Token
  NEAR Protocol
  Uniswap
  First Digital USD
  Aptos
Aptos  OKB
OKB  Bittensor
  Filecoin
  Cosmos Hub
  Render
  Stellar
  Arbitrum
  Maker
Maker  Hedera
  Immutable
  dogwifhat
  The Graph
  Ethena USDe
  Optimism
  Wrapped eETH
  Injective