
Ethereum Price Prediction – January 2
The Ethereum price prediction needs to cross above the $4000 resistance level quickly so as to deny the bears the opportunity to enter into the market.
ETH/USD Market
Key Levels:
Resistance levels: $4200, $4400, $4600
Support levels: $3200, $3000, $2800
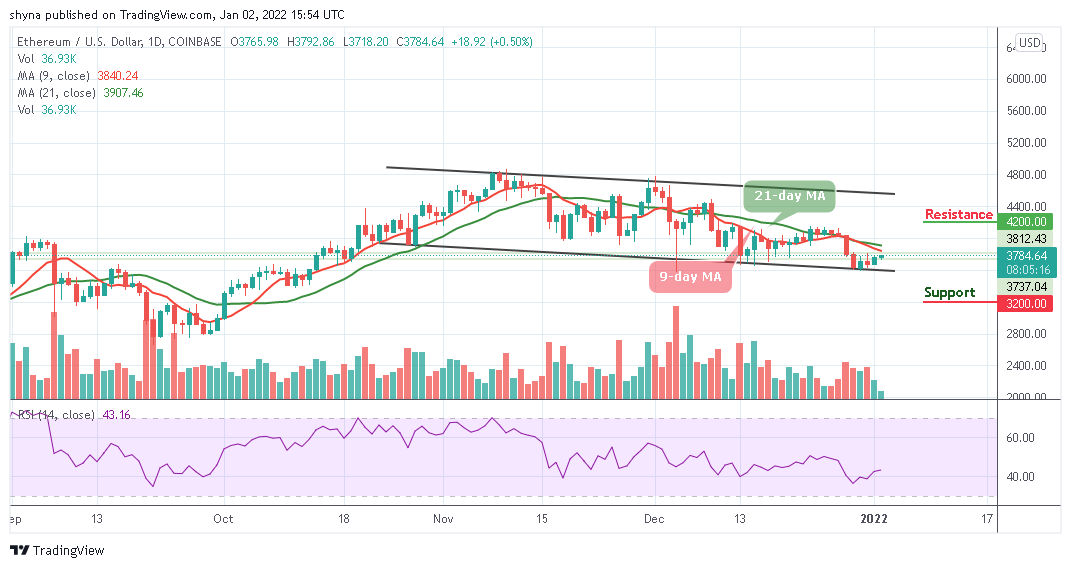
ETHUSD – Daily Chart
ETH/USD is currently hovering above $3700 as the coin prepares to gain more bullish signals. The movement to the upside may not allow the coin to bow to the selling activity going on in the market. However, Ethereum (ETH) is trading towards the 9-day and 21-day moving averages. In the short term, bearish momentum is very likely especially if the bulls fail to hold the price above $4000 and the red-line of the 9-day MA is still below the green-line of the 21-day MA.
Ethereum Price Prediction: Would Ethereum (ETH) Continue Higher?
The Ethereum price may need to rise and break above the 9-day and 21-day moving averages before resuming the previous bullish trend but may remain beneath for a while before turning bullish. Therefore, if the sellers push lower, traders can expect very strong support at $3500; this could then be followed up with another support at $3300. If the bears push further below, additional supports may be located at $3200, $3000, and $2800.
In the meantime, if the buyers continue with the bullish movement, the first level of resistance could be found at $3800. Further bullish movement could hit the potential resistance levels at $4200, $4400, and $4600 while the Relative Strength Index (14) moves above 40-level to indicate an average bullish movement within the market. However, if the technical indicator dips beneath this level, the Ethereum price may head lower to the downside.

When compares with Bitcoin, the Ethereum price keeps trading as market keeps moving sideways. ETH/BTC is currently trading at 7989 SAT and the coin prepares to cross above the 9-day moving average. However, if the price drop and move towards the lower boundary of the channel, the next key support may come at 7400 SAT and below.
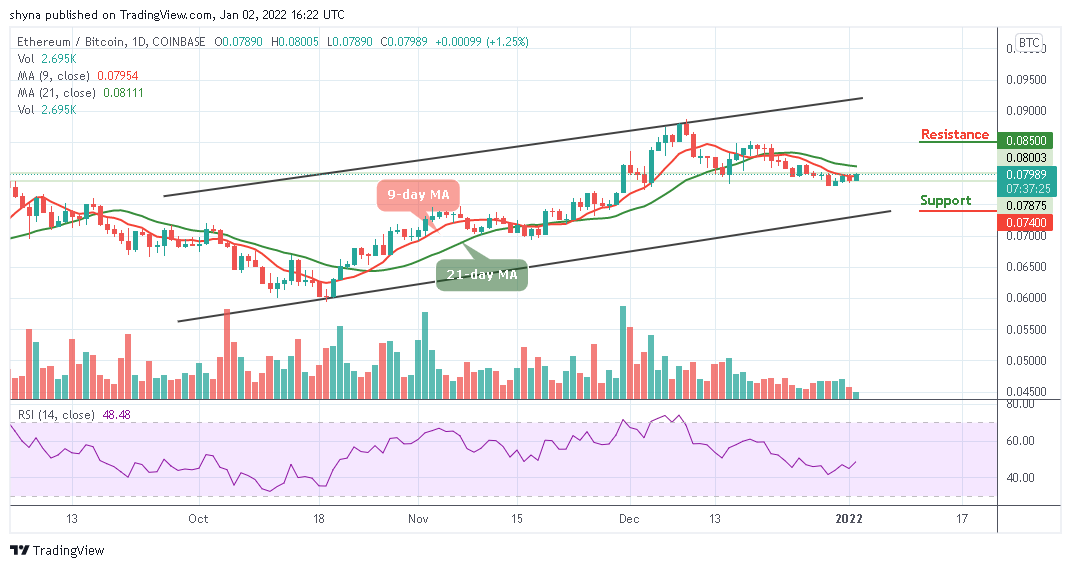
ETHBTC – Daily Chart
However, a continuous bullish movement could push the market above the 9-day and 21-day moving averages, a break above this barrier may enable the Ethereum price to reach the resistance level of 8500 SAT and above as the Relative Strength Index (14) moves to cross above 50-level, which shows that the market might experience further bullish movement.
Looking to buy or trade Ethereum (ETH) now? Invest at eToro!
68% of retail investor accounts lose money when trading CFDs with this provider
Credit: Source link


 Bitcoin
  Ethereum
  Tether
  BNB
BNB  Solana
  USDC
USDC  XRP
XRP  Dogecoin
  Toncoin
  Cardano
  Shiba Inu
  Avalanche
  Wrapped Bitcoin
  Bitcoin Cash
  Polkadot
  Polygon
  Litecoin
  NEAR Protocol
  LEO Token
  Uniswap
  First Digital USD
  Aptos
Aptos  OKB
OKB  Filecoin
  Bittensor
  Cosmos Hub
  Stellar
  Render
  Arbitrum
  Maker
Maker  Hedera
  Immutable
  dogwifhat
  The Graph
  Ethena USDe
  Optimism
  Pepe
Pepe  Wrapped eETH
