
Ethereum Price Prediction – December 5
At the time of writing, the Ethereum price is seen moving above the $4000 price mark and it is currently changing hands at $4148.
ETH/USD Market
Key Levels:
Resistance levels: $4600, $4800, $5000
Support levels: $3600, $3400, $3200
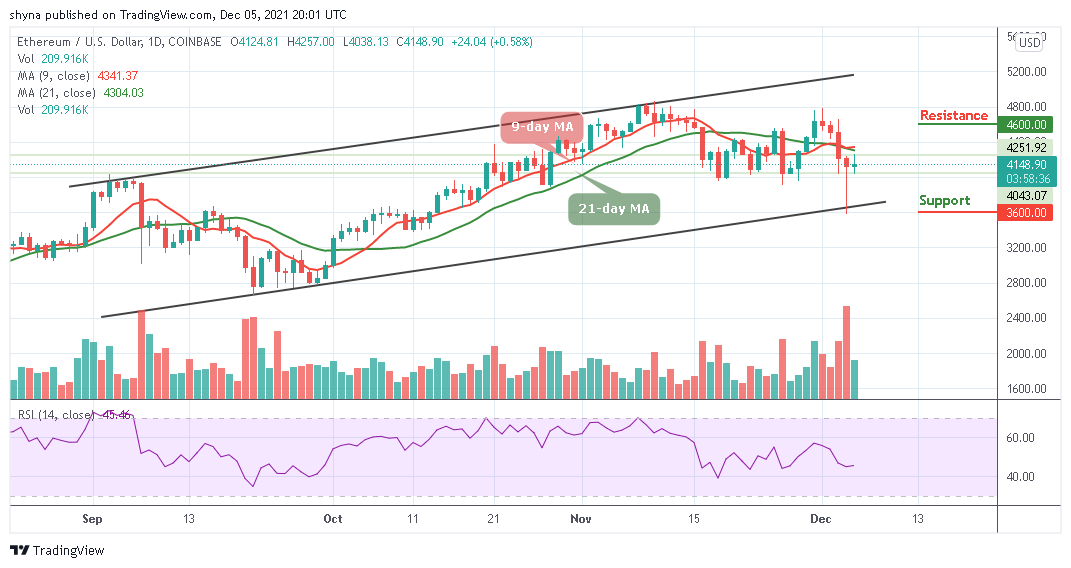
ETH/USD has once again touches the $4200 mark as the number two crypto faces the path of development once again but this can only be confirmed if the market price remains above $4000. However, the Ethereum price is hovering below the 9-day and 21-day moving averages with 0.58% gains in the last 24 hours. Meanwhile, ETH/USD may again drop below this level if the bulls fail to push the price above the moving averages.
Ethereum Price Prediction: Ethereum (ETH) May Gain More
As the daily chart reveals, traders can observe that since the beginning of this month, the Ethereum price has not been able to display the strong bullish movement. Therefore, the Ethereum price needs to stay above $4000 consistently for the next few days to regain the proper bullish momentum as the technical indicator Relative Strength Index (14) remains above 45-level.
However, at the time of writing, the Ethereum price only needs to conquer a few crucial resistance levels of $4200 and $4400 to recover the recent loses. Now, if the coin closely manages these levels well, then it could reach the potential resistance levels at $4600, $4800, and $5000 respectively. On the downside, if the bears wish to maintain their drive, ETH/USD may likely drop below the lower boundary of the channel, and then further bearish movement could drag it to the critical supports at $3600, $3400, and $3200 respectively.

Against Bitcoin, Ethereum is currently trading above the 9-day and the 21-day moving averages, getting ready to also cross above the upper boundary of the channel. The Ethereum price is changing hands at 8460 SAT as the technical indicator Relative Strength Index (14) moves into the overbought region.
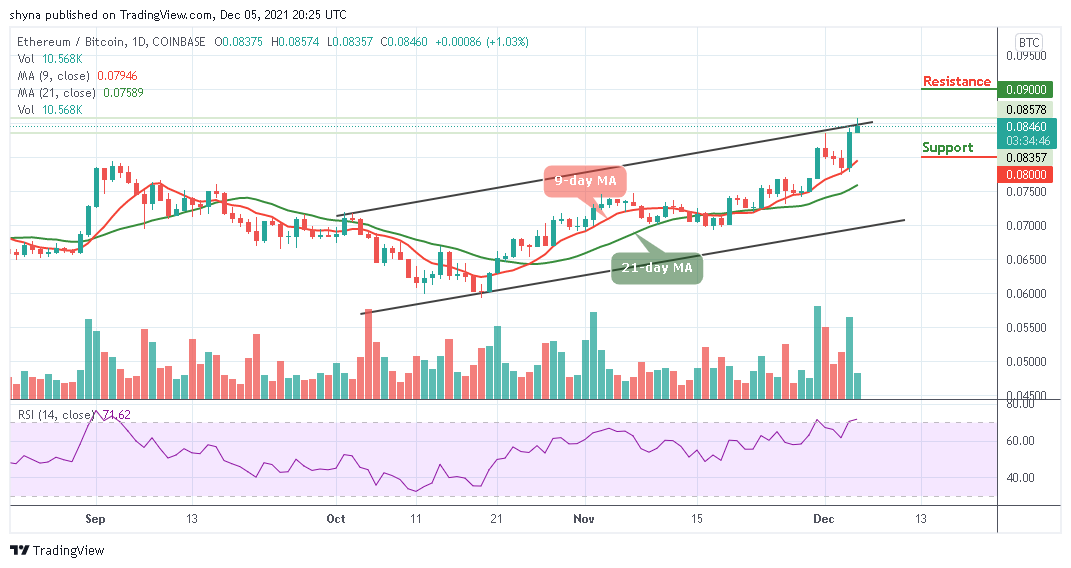
However, the daily chart reveals that buyers are having the day as the coin touches the daily high of 8574 SAT. Further bullish movement could hit the resistance level of 9000 SAT and above. Conversely, a lower sustainable move below the 9-day moving average may likely cancel the bullish pattern and could attract new sellers to hit the support at 8000 SAT and below.
Looking to buy or trade Ethereum (ETH) now? Invest at eToro!
68% of retail investor accounts lose money when trading CFDs with this provider
Credit: Source link


 Bitcoin
  Ethereum
  Tether
  BNB
BNB  Solana
  USDC
USDC  XRP
XRP  Dogecoin
  Toncoin
  Cardano
  Shiba Inu
  Avalanche
  Wrapped Bitcoin
  Bitcoin Cash
  Polkadot
  NEAR Protocol
  Polygon
  Litecoin
  Uniswap
  LEO Token
  First Digital USD
  Hedera
  Aptos
Aptos  Stellar
  Cosmos Hub
  Filecoin
  Render
  OKB
OKB  Immutable
  Pepe
Pepe  Bittensor
  XT.com
  dogwifhat
  Arbitrum
  Maker
Maker  Optimism
  The Graph
  Wrapped eETH
