
Join Our Telegram channel to stay up to date on breaking news coverage
The Solana price prediction is recovering from the daily low of $12.86 level as the price keeps ranging above the moving averages.
Solana Prediction Statistics Data:
- Solana price now – $12.96
- Solana market cap – $4.7 billion
- Solana circulating supply – 367.8 million
- Solana total supply – 537.6 million
- Solana Coinmarketcap ranking – #15
SOL/USD Market
Key Levels:
Resistance levels: $25, $27, $29
Support levels: $5, $3, $1
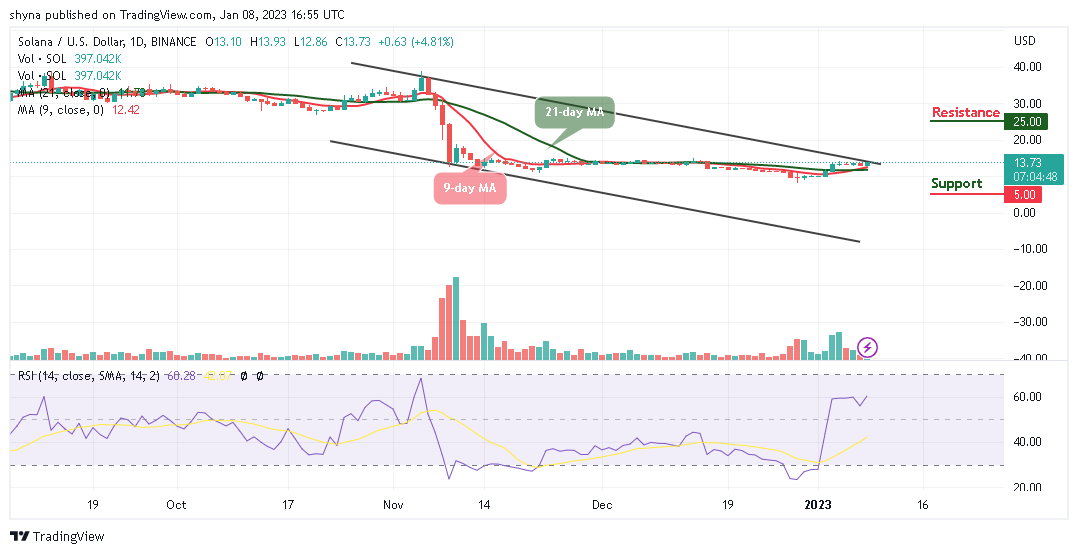
SOL/USD is trading above the 9-day and 21-day moving averages after touching the daily low at $12.86. At the time of writing, the Solana price is changing hands at $13.73, having gained over 4.81% since the beginning of the European session. However, with latest the recovery, the digital asset is likely to cross above the upper boundary of the channel to hit the nearest resistance level at $15.
Solana Price Prediction: Can SOL Break Above $15?
The Solana price is currently above the 9-day and 21-day moving averages as the coin gets ready for the upside. However, if the bulls begin the upward trend, SOL/USD may likely cross above the channel which could touch the resistance levels of $25, $27, and $29. On the other hand, if the Solana price slides below the moving averages, any strong selling pressure could drag the price toward the lower boundary of the channel.
However, if the bulls failed to push the market price above the channel, a bearish continuation could bring it to the support levels of $5, $3, and $1 respectively. Meanwhile, the technical indicator Relative Strength Index (14) is seen crossing above the 60-level, indicating a possible bullish movement.
Against Bitcoin, the SOL bulls are now showing little commitment to the market movement. However, following the recent positive sign, the current market movement could follow an uptrend if the buyers push the price above the upper boundary of the channel.
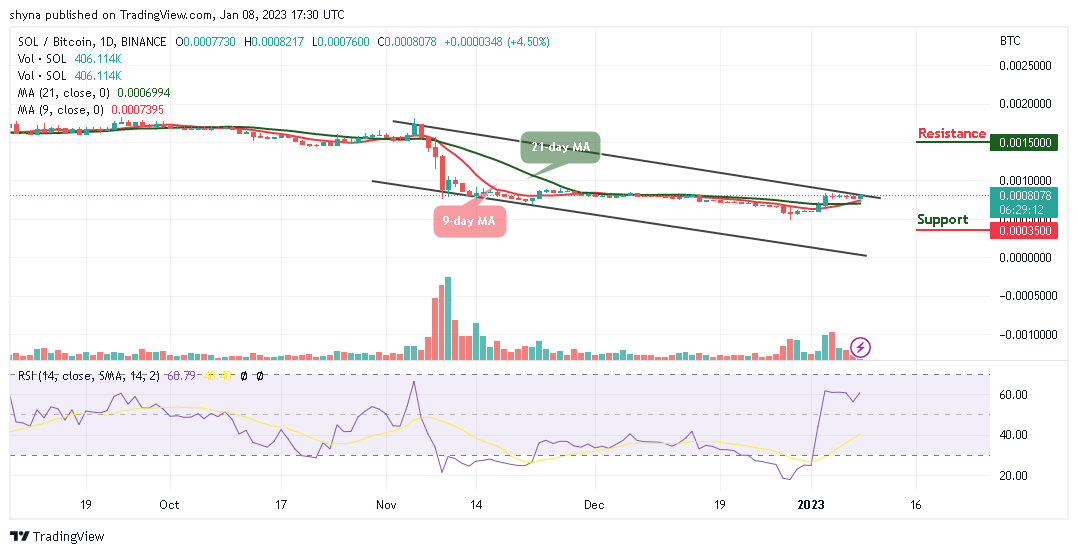
Therefore, as the technical indicator Relative Strength Index (14) crosses above the 60-level, the market price could resume an upward trend which could touch the resistance level of 1500 SAT and above. Meanwhile, a retest below the 9-day and 21-day moving averages could lower the price to the support level of 350 SAT and below.
On that note, Dash 2 Trade gives you the ability to optimize your trading and speculative profitability with effective crypto trading recommendations, auto trading, and analytics features. There is a D2T token presale ongoing and time is running out. Almost $15 million has been raised so far. You can check the platform beta version here.
Related
Dash 2 Trade – Presale Ends Soon
- Active Presale Live Now – dash2trade.com
- Featured in Cointelegraph – $13M Raised
- KYC Verified & Audited
- Native Token of Crypto Signals Ecosystem
- Upcoming Listings Jan 11 – Gate.io, Bitmart, LBank, Changelly
Join Our Telegram channel to stay up to date on breaking news coverage
Credit: Source link


")


 pumps as Elon teases Twitter integration, Orbeon…")


 Bitcoin
  Ethereum
  Tether
  BNB
BNB  Solana
  USDC
USDC  XRP
XRP  Dogecoin
  Toncoin
  Cardano
  Shiba Inu
  Avalanche
  Wrapped Bitcoin
  Polkadot
  Bitcoin Cash
  NEAR Protocol
  Polygon
  Litecoin
  Uniswap
  LEO Token
  Hedera
  First Digital USD
  Aptos
Aptos  Render
  Filecoin
  dogwifhat
  Stellar
  Immutable
  Cosmos Hub
  OKB
OKB  Bittensor
  Pepe
Pepe  Arbitrum
  XT.com
  Maker
Maker  The Graph
  Optimism
  Fetch.ai