
Solana Price Prediction – August 28
There have been continual, consistent ups and downs across the wide-trading space in the SOL/USD market as the crypto economy averages a lower range. Yesterday’s low and high values are $30.95 and $32.21. Price is trading around $31.45 at a minute negative percentage rate of 0.29.
Solana (SOL) Statistics:
SOL price now – $31.45
SOL market cap – $11 billion
SOL circulating supply – 349.4 million
SOL total supply – 511.6 million
Coinmarketcap ranking – #9
SOL/USD Market
Key Levels:
Resistance levels: $50, $55, $60
Support levels: $25, $20, $15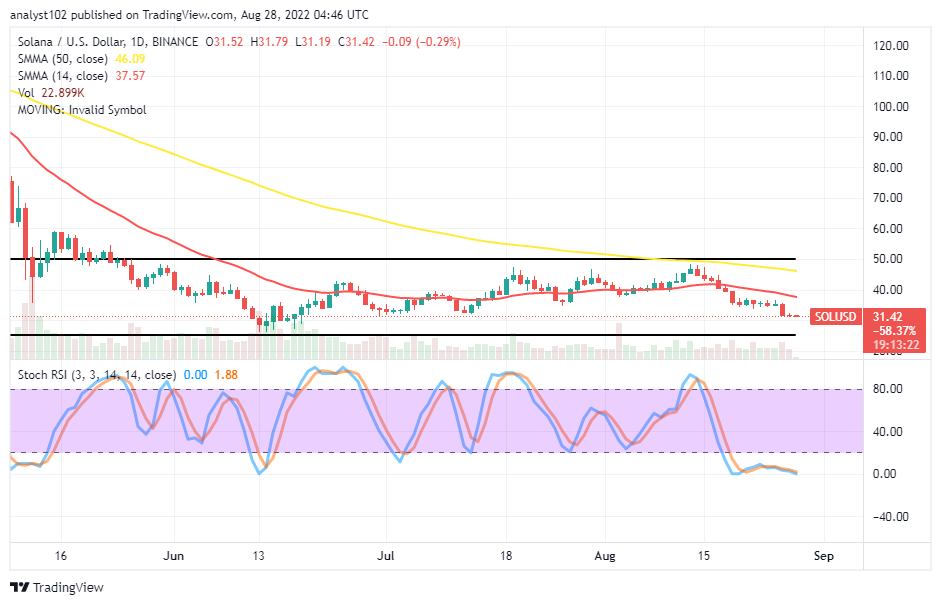 SOL/USD – Daily Chart
The SOL/USD daily chart showcases the crypto-economic market averages lower range around the $25 value line. Variant candlesticks have been underneath the trend lines of the SMAs. The 14-day SMA indicator is at $37.57, beneath the $46.09 value line of the 50-day SMA indicator. The upper horizontal line drew at $50, and the lower horizontal line drew at the $25 support level. The Stochastic Oscillators have dipped into the oversold region, maintaining 1.88 and 0.00 range points.
Buy Solana Now
Your capital is at risk.
Is the SOL/USD market going to lower more sustainably?
Lowering the SOL/USD market at this point may open to a costly risk, lacking every sense of sustainability if the price tempts to touch close to the lower-trading zone at $25. However, in the meantime, there has been no tangible signal suggesting a return of decent buying moment. Based on that, long-position placers are to wait for the emergence of a bullish candlestick to confirm the possible change of direction to the upside before considering launching long position orders.
On the downside of the technical analysis, the conjoining of the Stochastic Oscillators in the oversold region serves as a consolidation moving mode confirmation, suggesting that selling activities are yet to be exhausted. But, the only un-technically trading angle to that effect is that it lacks a visible entry point to join the possible downward motion that can occur at this current trading capacity. A bullish candlestick emerging at a lower spot will summarily invalidate getting to see more lows afterward.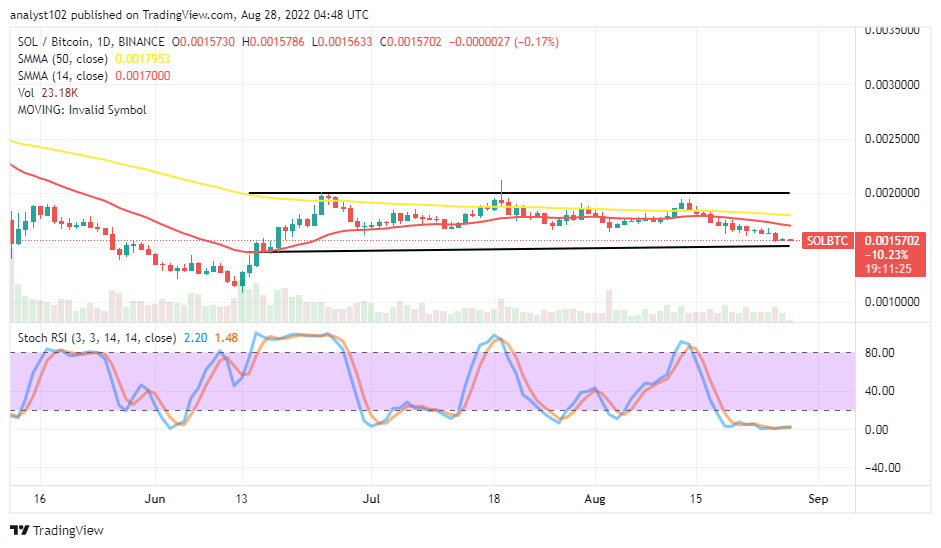

SOL/BTC Price Analysis
Solana has kept trading in range-bound zones at considerably higher-trading value lines over a couple of sessions, pairing with Bitcoin. The 14-day SMA indicator has been underneath the 50-day SMA indicator. The Stochastic Oscillators have penetrated and conjoined in the oversold region. And they are at 2.28 and 1.48 range points. The cryptocurrency pair price averages lower range line tightly. A sustainable breakdown at the lower-range value line drawn will nudge the base crypto into the furtherance of more debases.
Tamadoge – Play to Earn Meme Coin

- Earn TAMA in Battles With Doge Pets
- Capped Supply of 2 Bn, Token Burn
- NFT-Based Metaverse Game
- Presale Live Now – tamadoge.io
Read more:
Credit: Source link


 Bitcoin
  Ethereum
  Tether
  BNB
BNB  Solana
  USDC
USDC  XRP
XRP  Dogecoin
  Toncoin
  Cardano
  Shiba Inu
  Avalanche
  Wrapped Bitcoin
  Bitcoin Cash
  Polkadot
  Polygon
  Litecoin
  NEAR Protocol
  Uniswap
  LEO Token
  Aptos
Aptos  First Digital USD
  Filecoin
  OKB
OKB  Stellar
  Cosmos Hub
  Render
  Arbitrum
  dogwifhat
  Immutable
  Bittensor
  Hedera
  Maker
Maker  Injective
  The Graph
  Optimism
  Ethena USDe
  Wrapped eETH
