
TL;DR
- U.S. CPI sparks upward revision to the expected fed-funds rate
- U.K. stays top of the G7 inflation league, with actual CPI year-over-year of 9.9%
- GBP saw new lows against the U.S dollar, same levels as 1985
- There’s a 30% probability of a 100bps rate hike in the next FOMC meeting
- Ethereum’s highly anticipated merge took place on Sept. 15 and was successful
- Goldman Sachs prepares for layoffs as deal-making slows
- FedEx CEO says he expects the economy to enter a ‘worldwide recession’ due to a big miss in earnings
- Bitcoin’s hash rate hits an all-time high
- Bitcoin difficulty adjustment hits all-time high
Macro Overview
CPI sparked a revision upwards to the expected fed-funds rate
Another upside U.S. inflation report sank hopes of the pace of policy tightening, which sent fixed-income yields and the dollar soaring. U.S. equities plunged in the worst one-day loss since mid-2020, with the expectation now on the fed to hike 75 bps next week. Core and headline inflation exceeded forecasts which caused investors to abandon previous assumptions of a 50 bps hike.
Consumer Price Index (CPI) is the index of the variation in prices for retail goods and other items. Headline CPI came in hotter than expected, as traders were convinced we were at ‘peak inflation,’ which sent markets into turmoil. Nasdaq closed 5.5% lower, Bitcoin fell below $20,000, and gold traded 1% below the previous close.
The two-year treasury rate is the yield received for investing in a U.S. government-issued security with a maturity of two years. The two-year yield is included in the shorter yield curve, which is an important indicator when observing the U.S economy. A big sell-off occurred in treasuries weighted to the front end that saw the two-year treasury reach its highest point since November 2007.
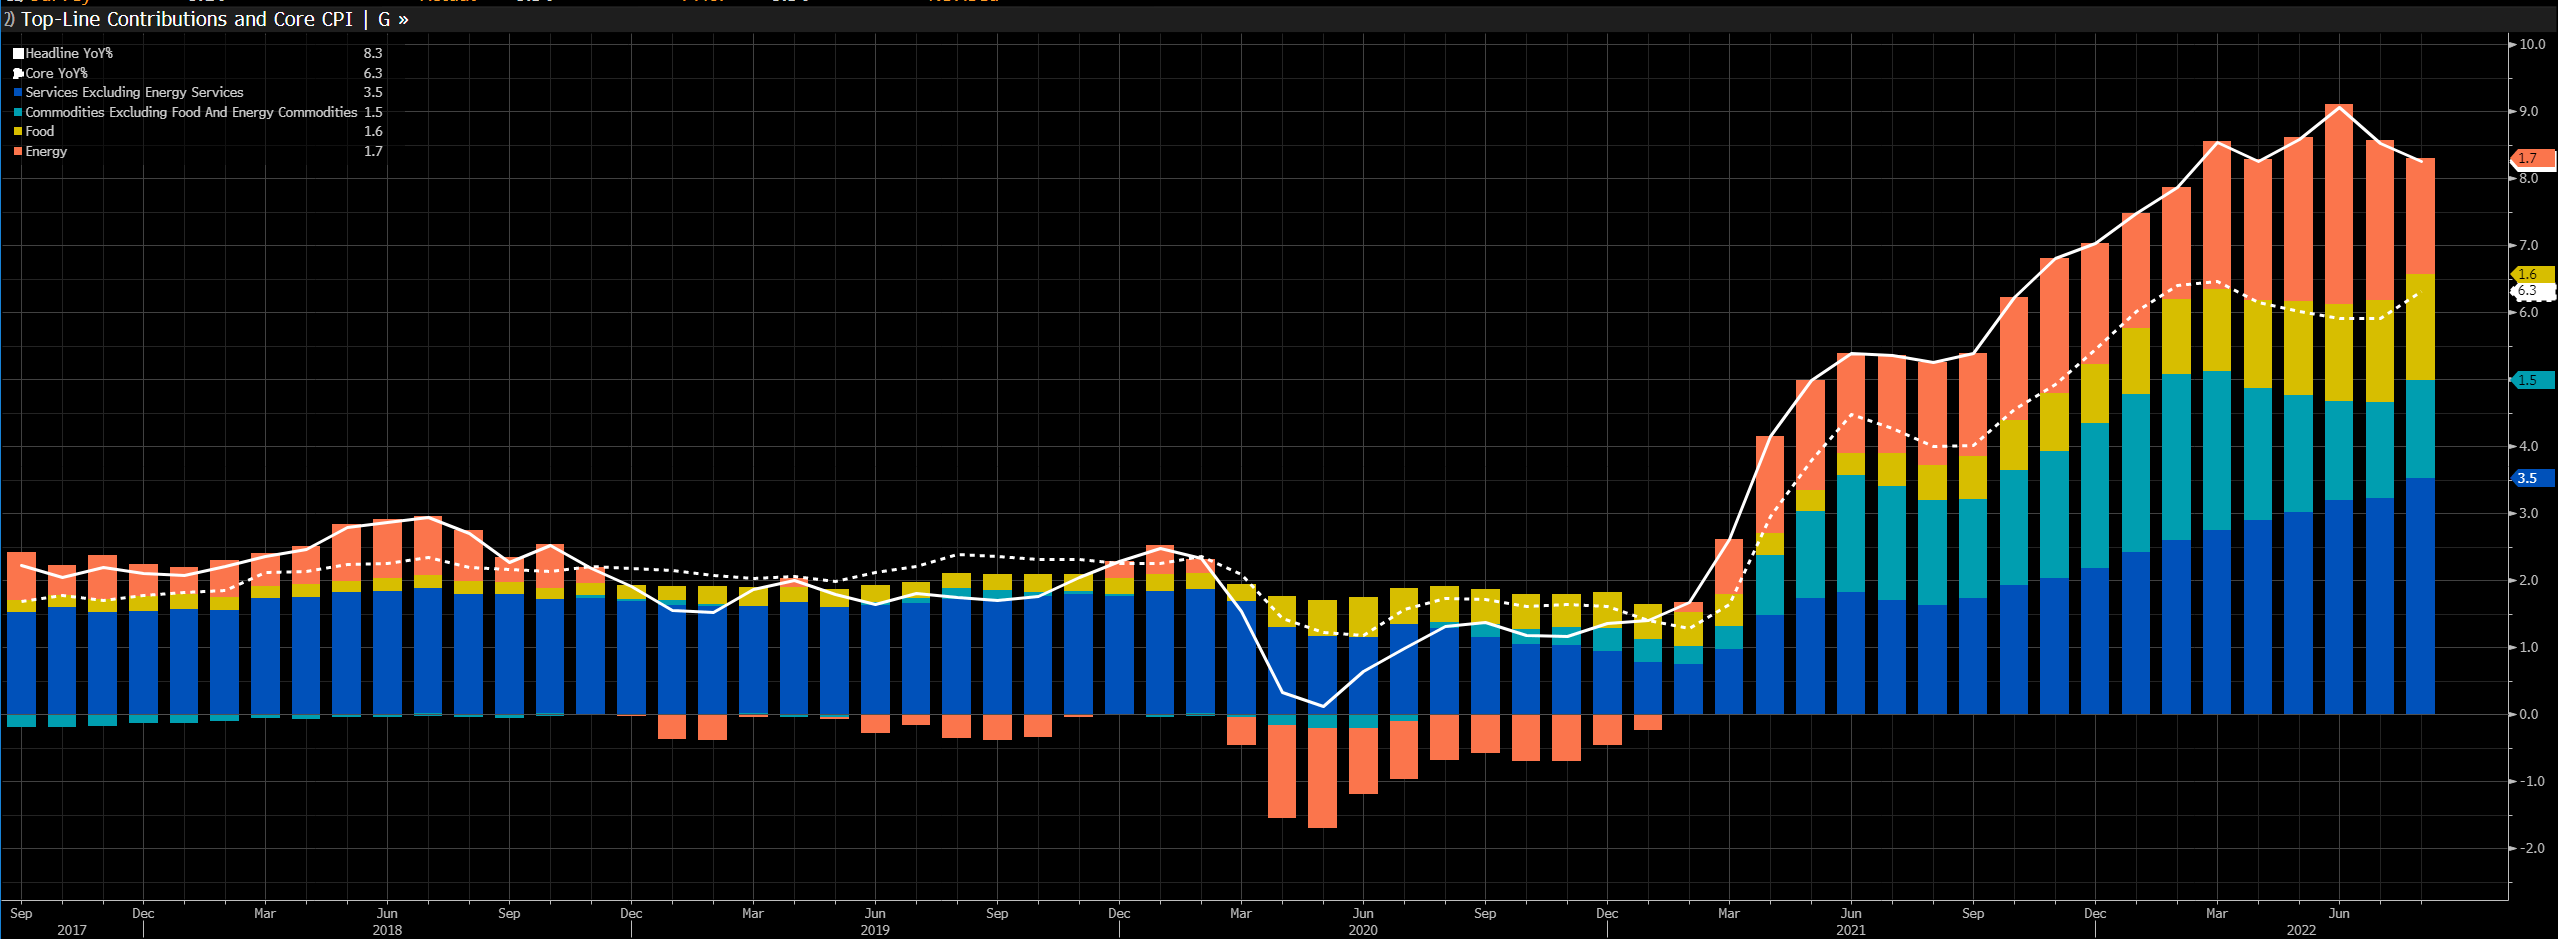
Headline inflation slowed from 8.5% to 8.3% thanks to a 10.6% monthly decline in gasoline, while other indexes also fell, including airline fairs and used cars. However, this was offset by a rise in food, shelter, and medical services.
The inflation wasn’t just supply chain issues but also the fiscal and monetary components. Flooding the system with broad money resets aggregate prices higher permanently, making the fed’s job to tame inflation that much harder.
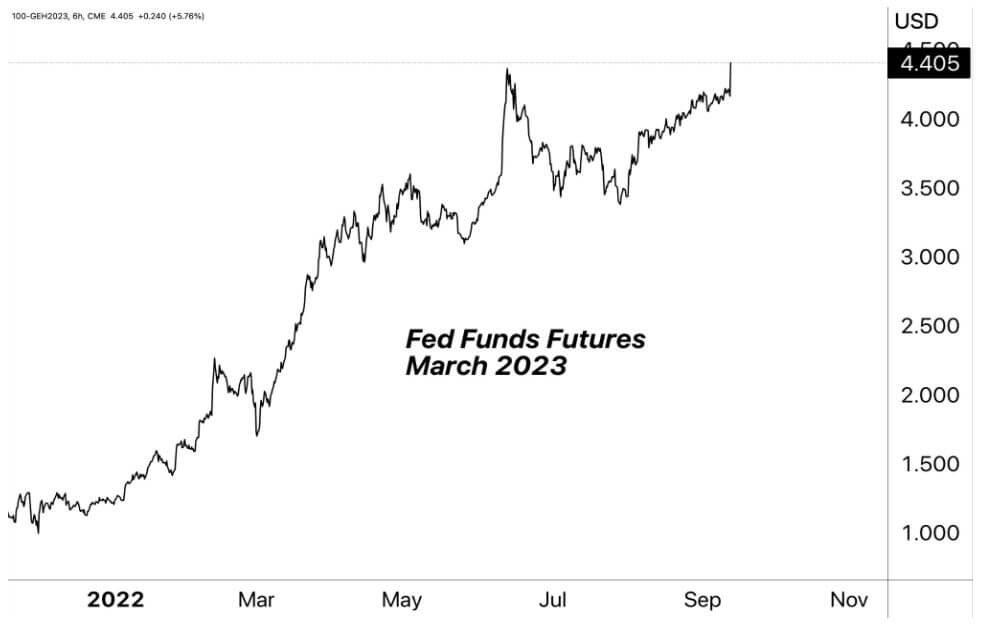
Fed funds futures exceed 4%
Inflation has been climbing for over two years, to be exact, 27 months of rising inflation. The food index had increased 11.4% YOY. However, most notably, the energy cost was up almost 25% YOY, the most significant 12-month increase since May 1979.
Due to a hotter-than-expected CPI print, the fed funds futures (derivatives based on the federal funds rate, the U.S. overnight interbank lending rate on reserves deposited with the Fed). Is now pricing in a 70 % chance of a 75 bps rate hike and a 30 % chance of a 100 bps hike for Sept. 21. Furthermore, the fed funds rate is projecting a terminal velocity of 4.5% to be reached by the first quarter of 2023 after the U.S. CPI data was released. Risk assets will continue to suffer as rates rise and liquidity dries from quantitative tightening (QT).
Correlations
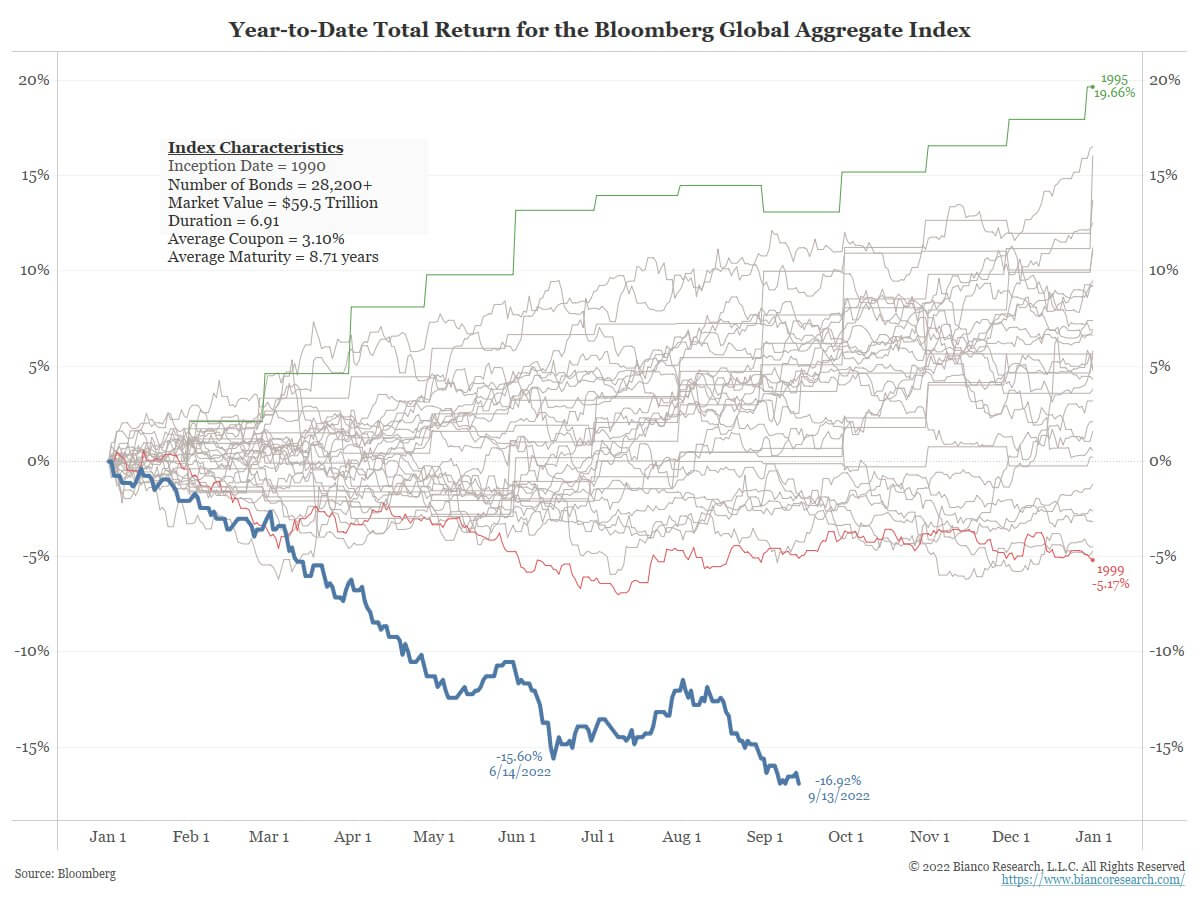
The year of the bear
The bears have been dominant for the majority of 2022. Sept. 13, Dow Jones plummeted more than 1,250 points and is trading lower than it was after Biden’s first full day in office (January 2021). The bond market has seen absolute carnage; the total return for the Bloomberg Global Aggregate Index set a new low on Sept. 13, down 16.93%, since its inception date back in 1990.
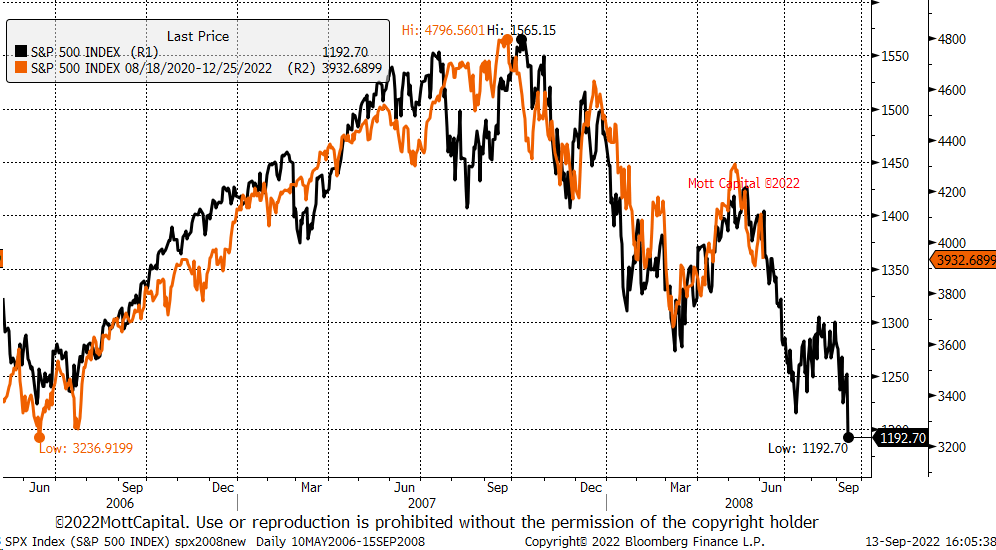
Wall Street has had its worst day since June 2020, as the S&P is flirting with bear market territory. The correlation chart shows the 2008 S&P performance (black) against the 2022 S&P performance (orange). A tight and symmetrical correlation with one another, and the worst is yet to come, according to the data.
Equities & Volatility Gauge
The Standard and Poor’s 500, or simply the S&P 500, is a stock market index tracking the stock performance of 500 large companies listed on exchanges in the United States. S&P 500 3,873 -4.2% (5D)
The Nasdaq Stock Market is an American stock exchange based in New York City. It is ranked second on the list of stock exchanges by market capitalization of shares traded, behind the New York Stock Exchange. NASDAQ 11,855 -4.3% (5D)
The Cboe Volatility Index, or VIX, is a real-time market index representing the market’s expectations for volatility over the coming 30 days. Investors use the VIX to measure the level of risk, fear, or stress in the market when making investment decisions. VIX 26 13.7% (5D)
Stonks
Year-to-date, Nasdaq is down 26%, S&P 500 is down 18%, and Dow is down 14%. Sept. 13, the Nasdaq had its biggest crash since march 2020 and could expect to see this trend continue until the end of the year as the fed continues to hike rates.
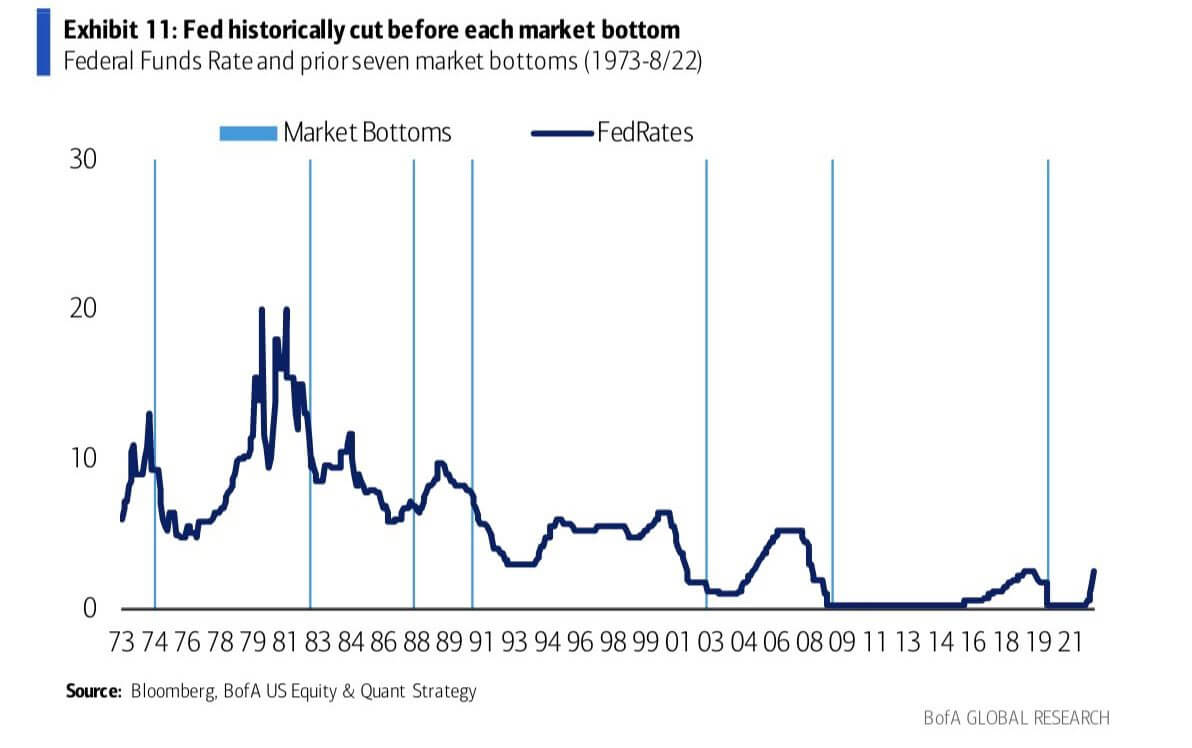
Historically in traditional markets, -20% is considered bear market territory. Bottoms in market cycles usually finish around the same time the fed funds rate starts cutting or pausing in their hiking cycle. As the fed continues on the path of destruction, it would be naïve to think the bottom is in for equities.
Commodities
The demand for gold is determined by the amount of gold in the central bank reserves, the value of the U.S. dollar, and the desire to hold gold as a hedge against inflation and currency devaluation, all help drive the price of the precious metal. Gold Price $1,676 -2.46% (5D)
Similar to most commodities, the silver price is determined by speculation and supply and demand. It is also affected by market conditions (large traders or investors and short selling), industrial, commercial, and consumer demand, hedge against financial stress, and gold prices. Silver Price $20 5.66% (5D)
The price of oil, or the oil price, generally refers to the spot price of a barrel (159 litres) of benchmark crude oil. Crude Oil Price $85 2.88% (5D)
SPR continues to get drained ahead of the mid-term elections
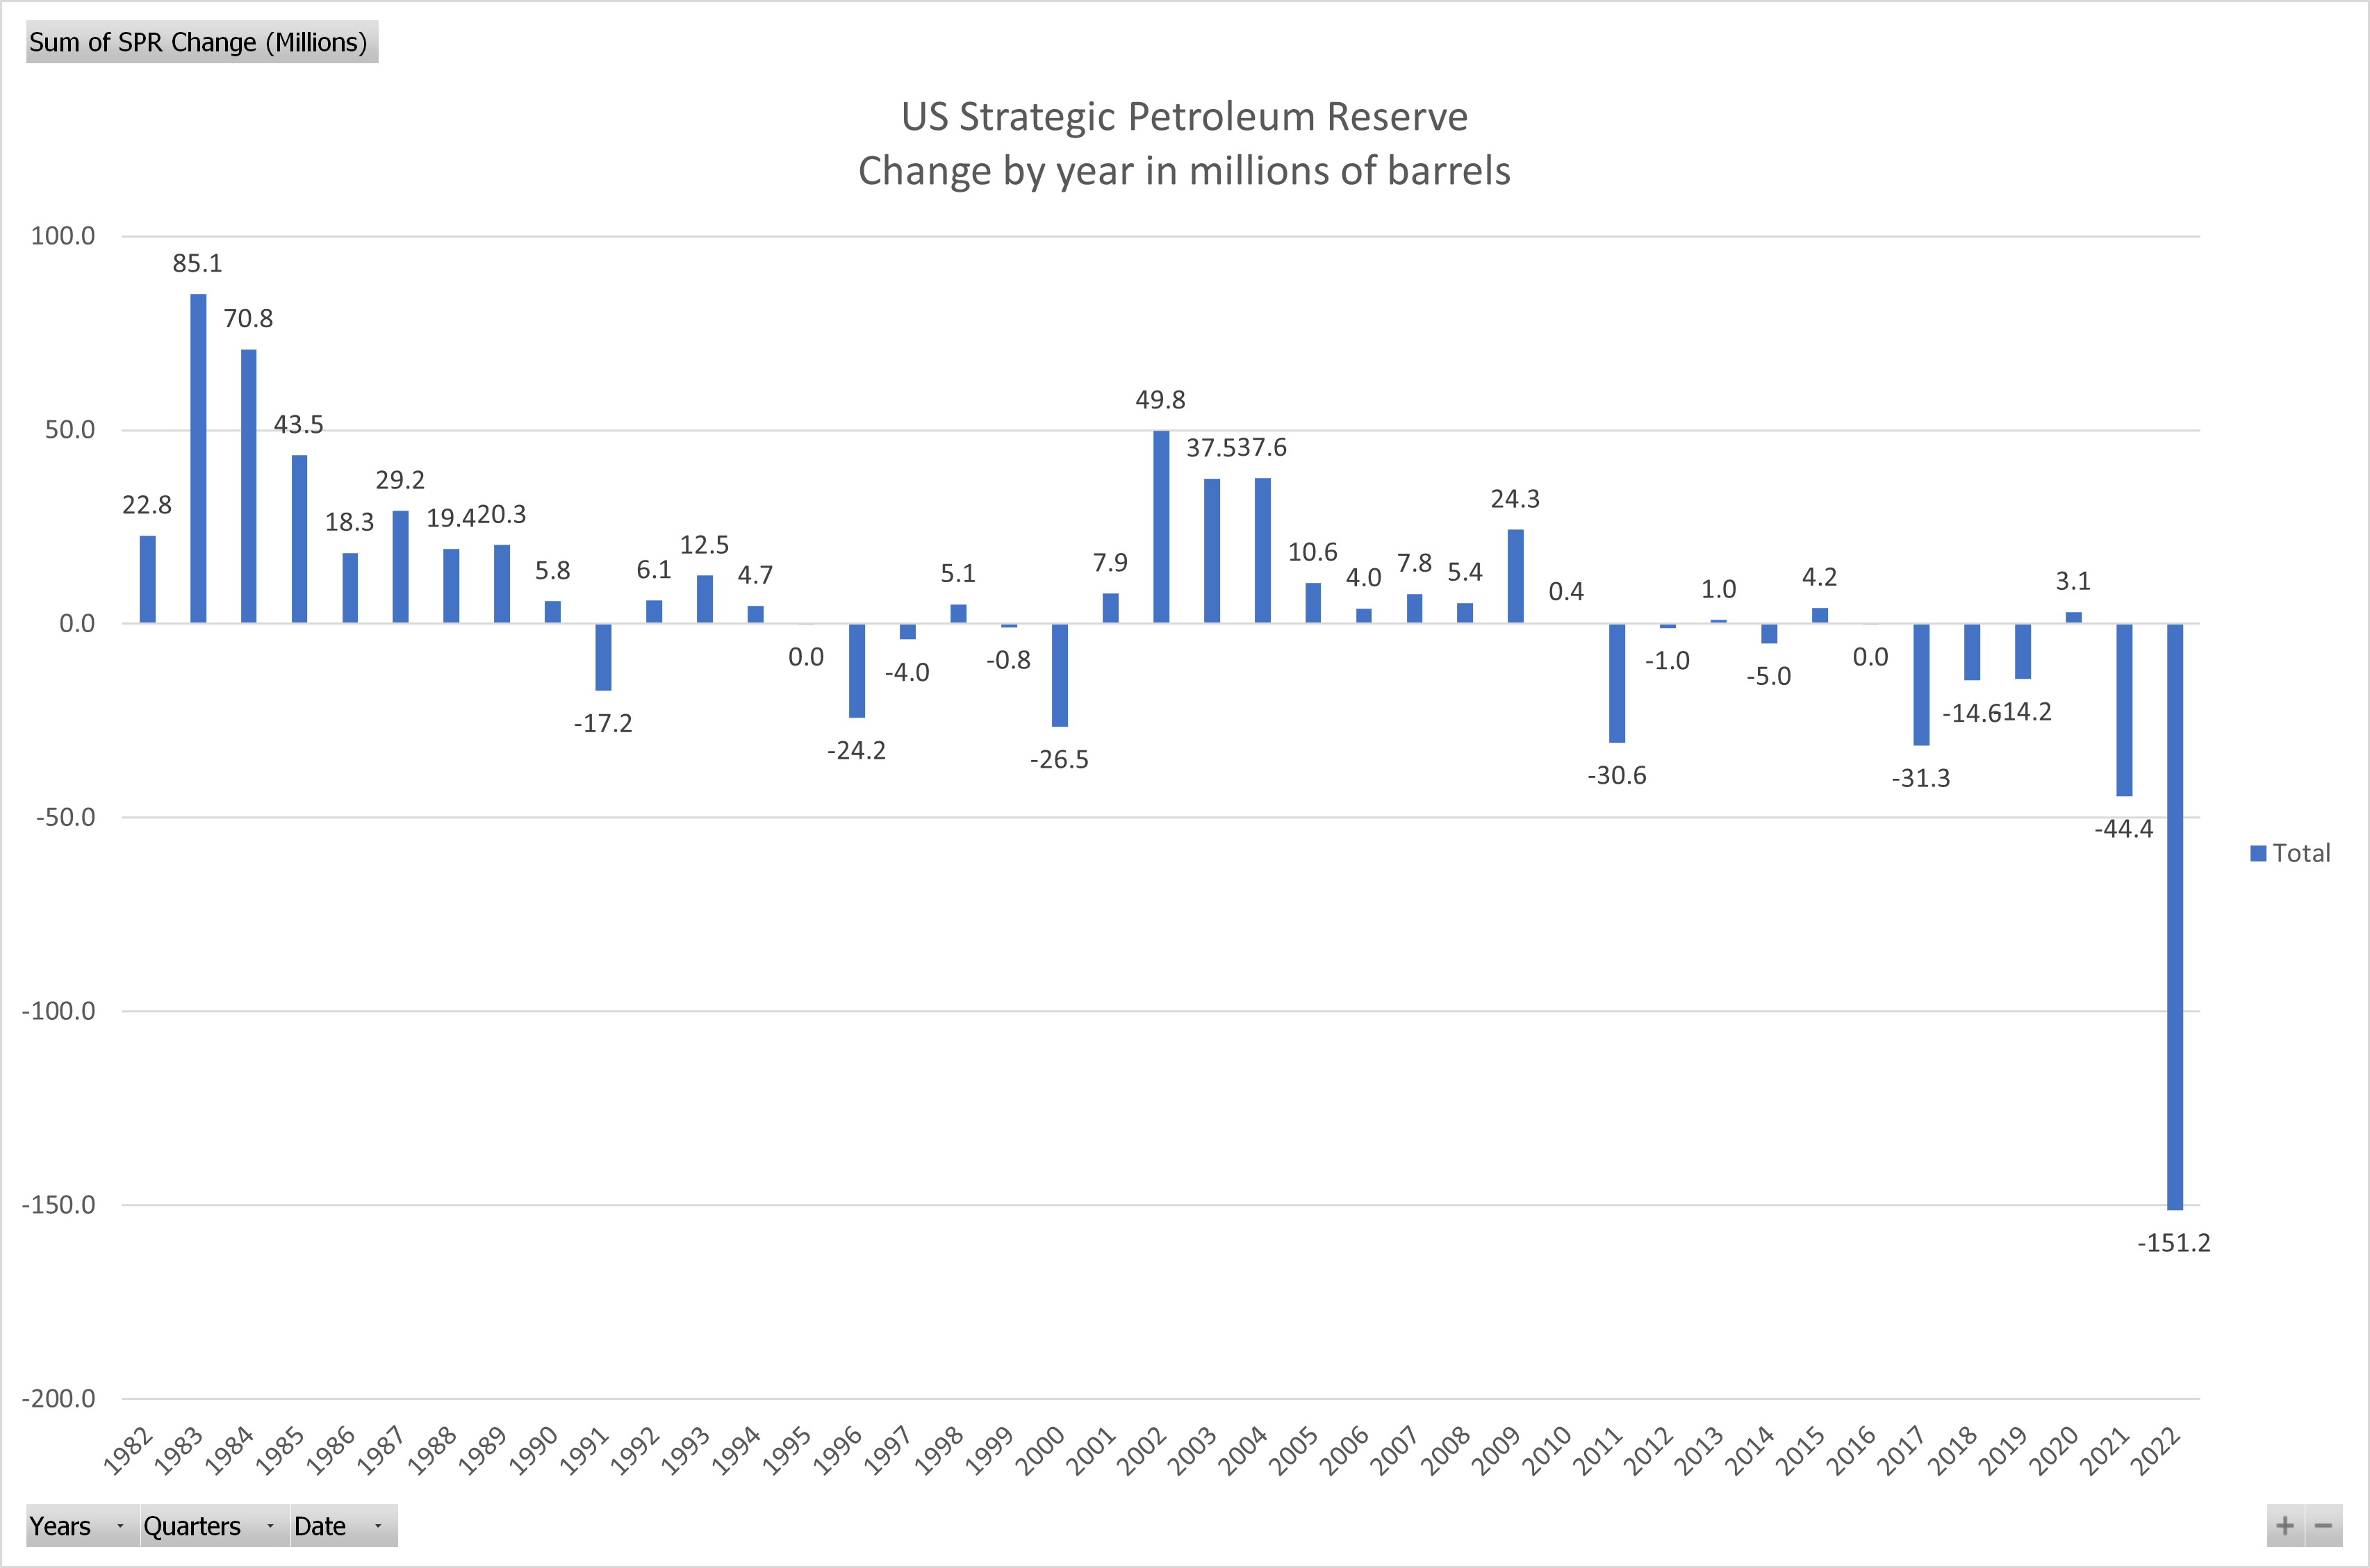
The Strategic Petroleum Reserve (SPR), one of the world’s largest suppliers of emergency crude oil, was introduced to aid disruption in petroleum supplies for the United States under the international energy program.
The SPR continues to get drained to ease short-term inflation pressures; the SPR performed the largest-ever weekly oil release on Sept. 12, injecting into the market 8.4 million barrels. The SPR is now at its lowest since October 1984.
However, reports are the Biden administration has planned to refill the SPR when crude oil prices begin to drop below $80 a barrel; it is currently trading around $90 a barrel.
Rates & Currency
The 10-year Treasury note is a debt obligation issued by the United States government with a maturity of 10 years upon initial issuance. A 10-year Treasury note pays interest at a fixed rate once every six months and pays the face value to the holder at maturity. 10Y Treasury Yield 3.451% 4.13% (5D)
The Consumer Price Index (CPI) measures the monthly change in prices paid by U.S. consumers. The Bureau of Labor Statistics (BLS) calculates the CPI as a weighted average of prices for a basket of goods and services representative of aggregate U.S. consumer spending. CPI Inflation 8.3% 0.1% (30D)
The U.S. dollar index is a measure of the value of the U.S. dollar relative to a basket of foreign currencies. DXY 109.6 0.54% (5D)
Fed is behind the curve, according to the bond market.
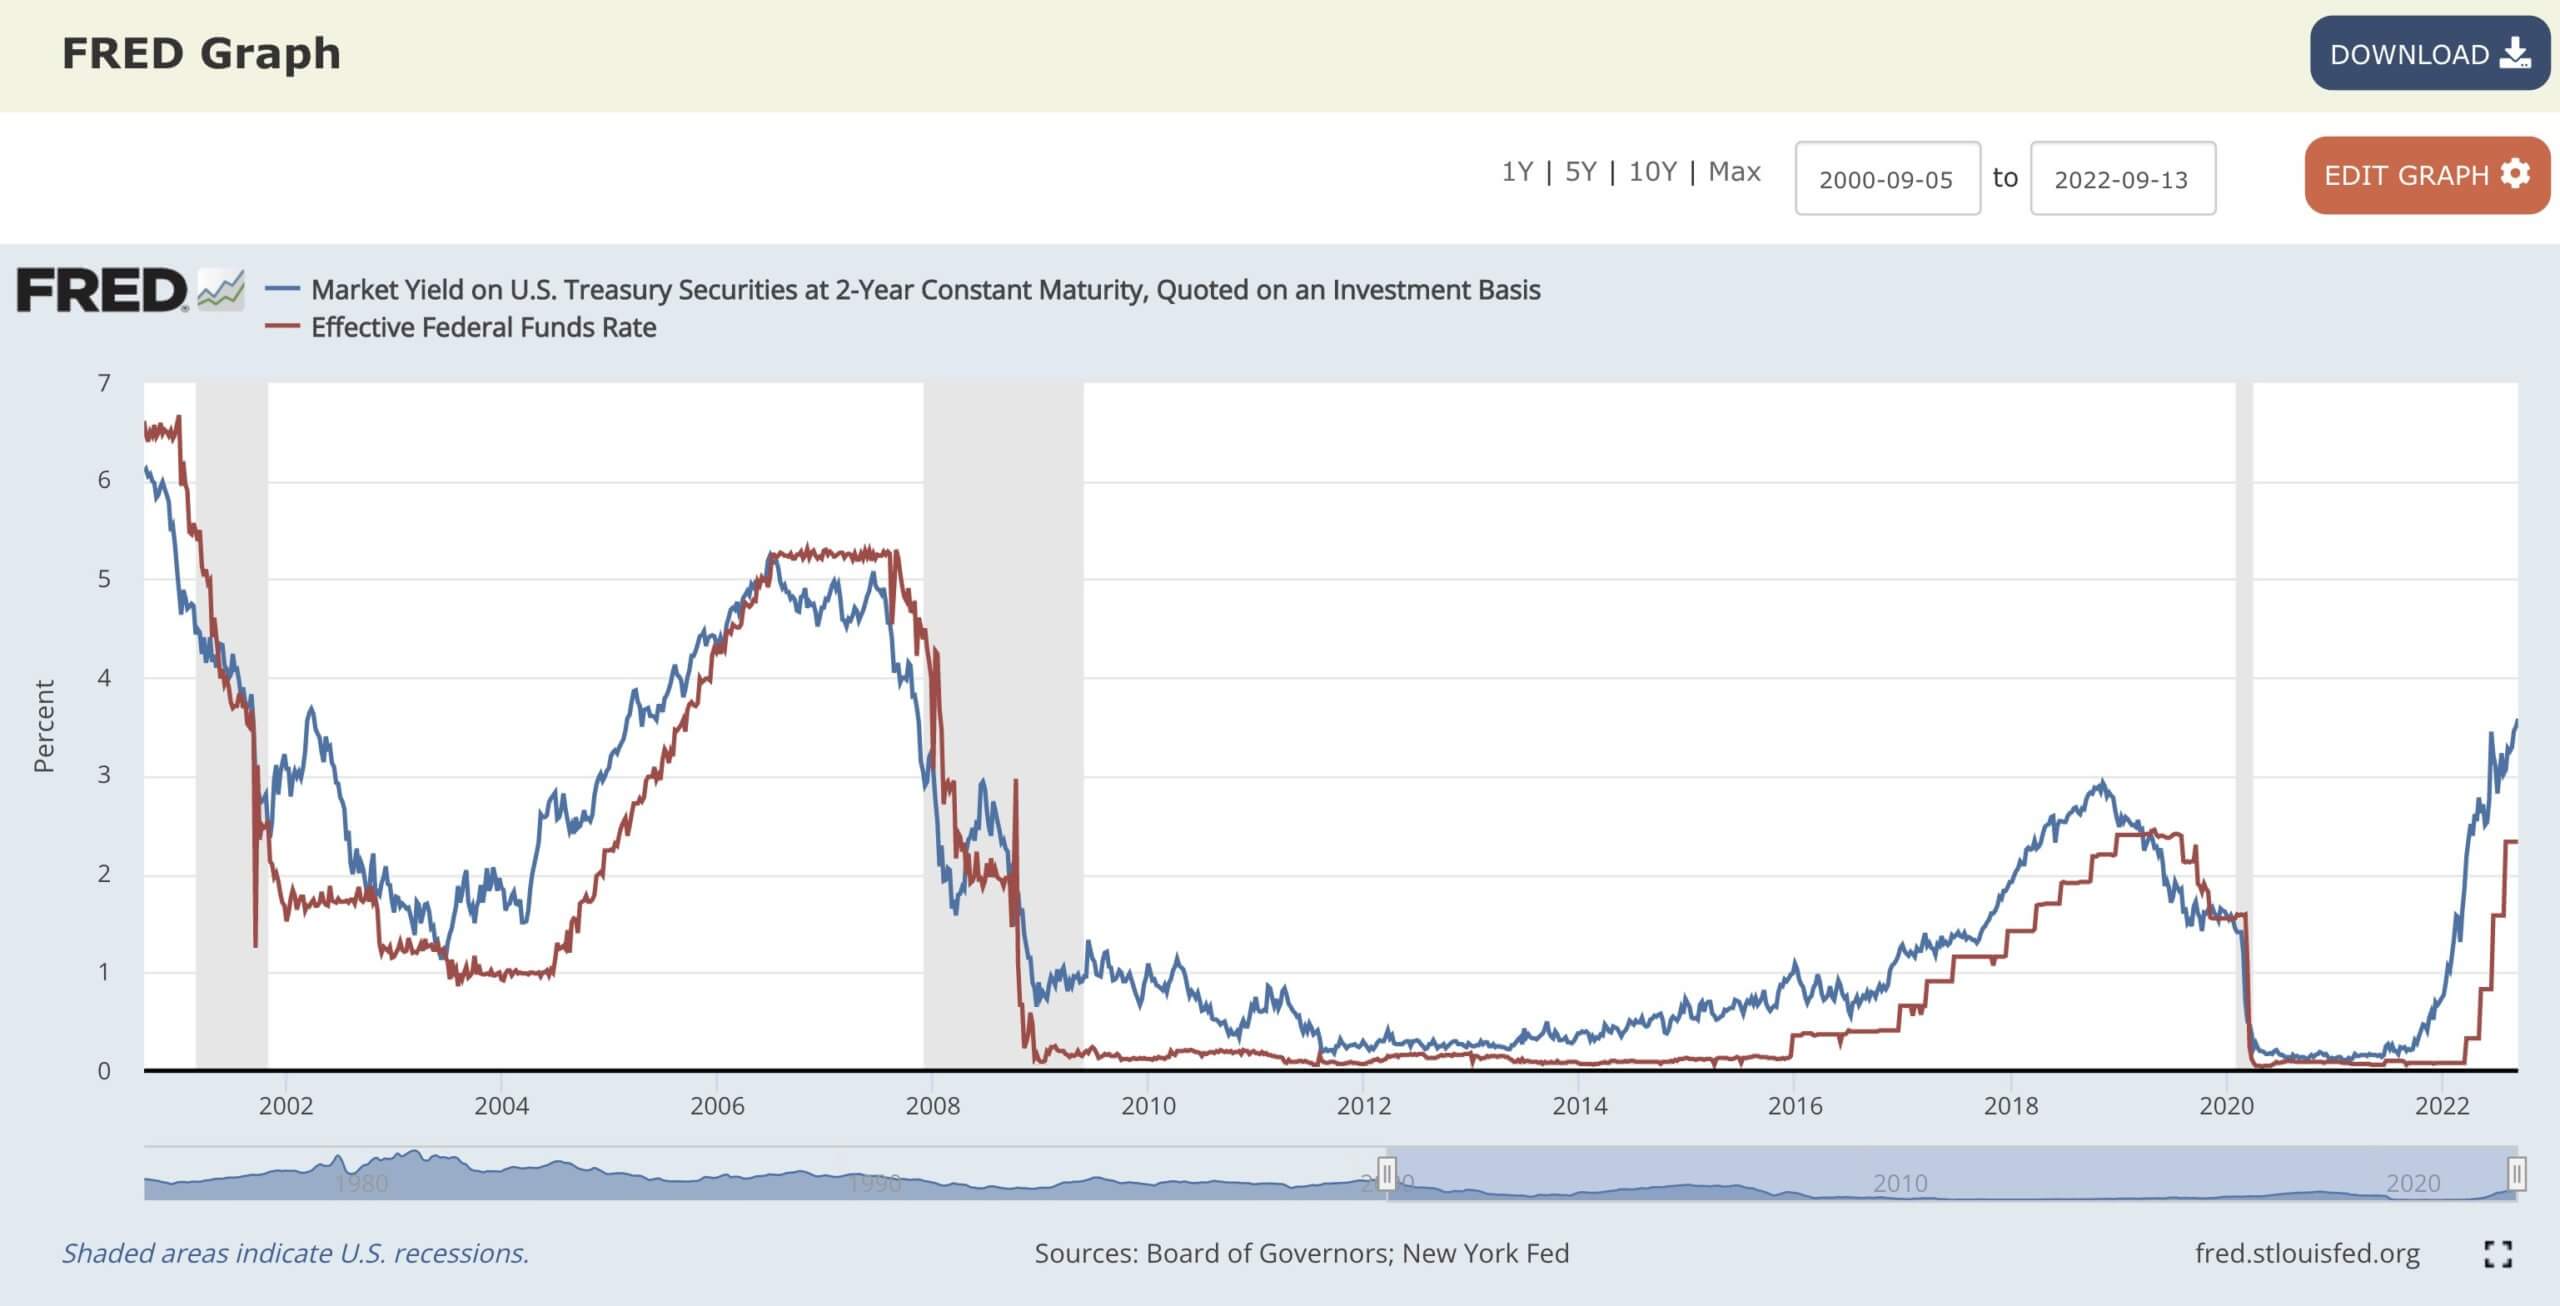
As mentioned, the two-year treasury broke out to highs last seen since November 2007 at 3.7%. Since early 2000, the fed funds rate and two-year treasury yield have been in tandem with one another. The current spread indicates the Fed has more room to raise rates as the fed funds rate is currently around 2.5%. A 100bps rate hike is still not enough to reach the “neutral rate,” according to the bond market. The Fed is still behind the curve.
10-2 year treasury deeply inverted
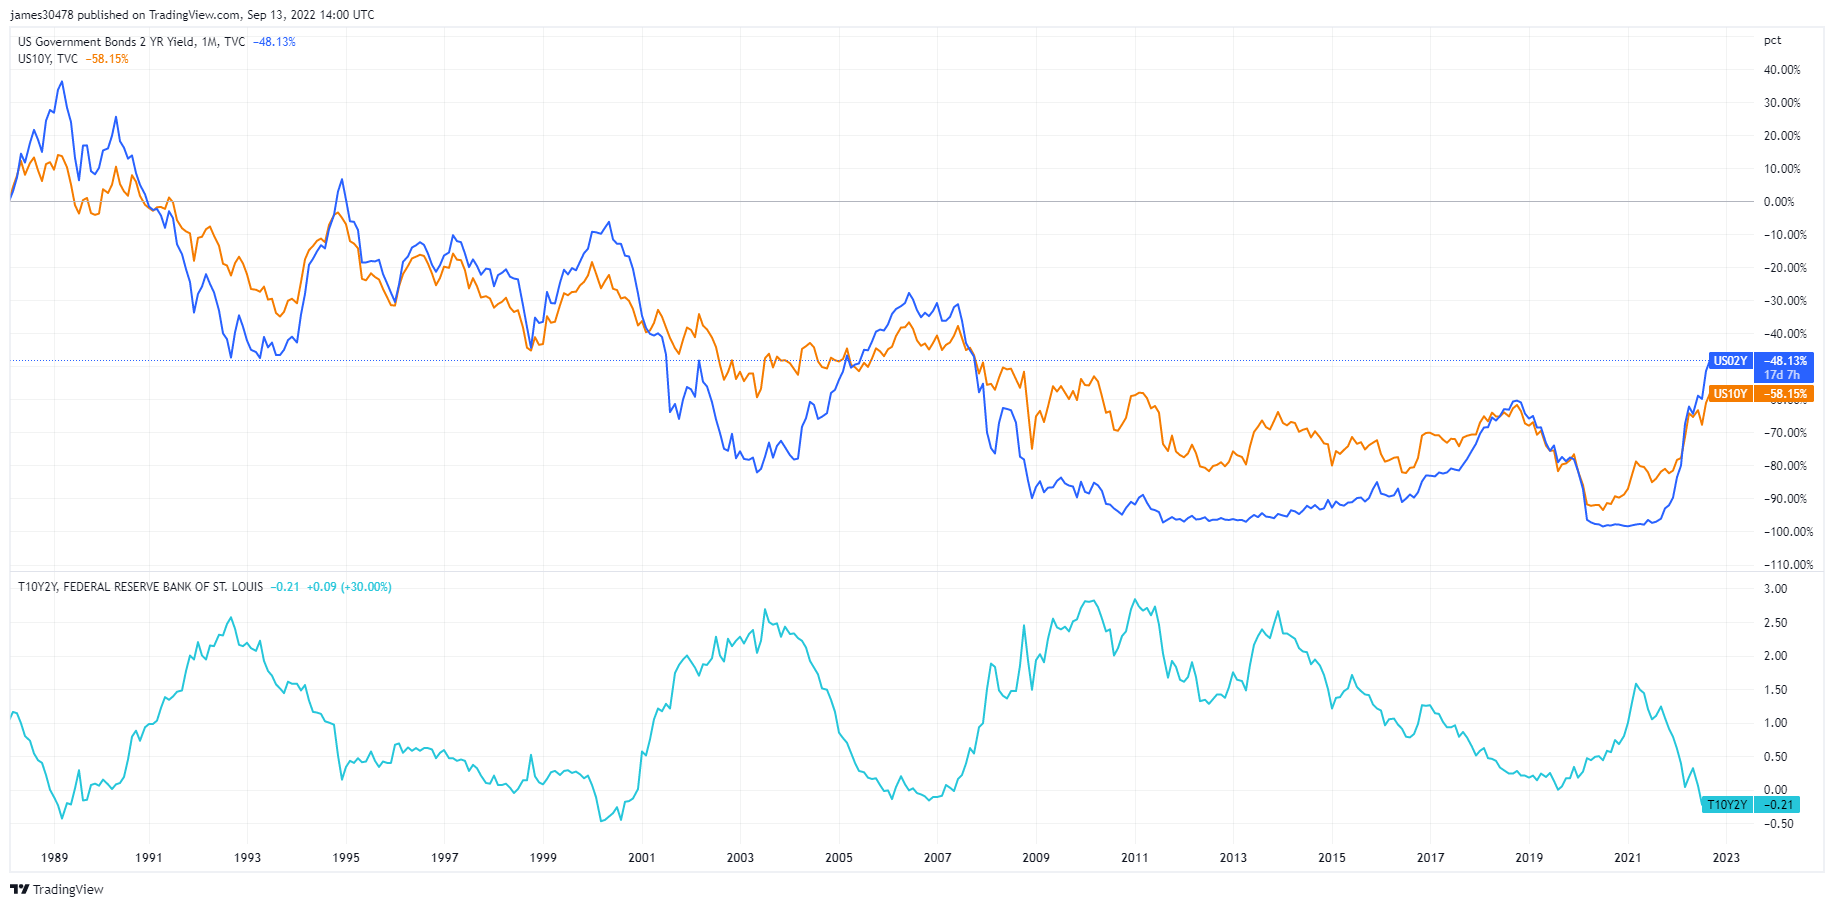
However, the ten-year to two-year treasury note spread is generally considered a warning of severe economic weakness. In contrast, the credit spreads widen during financial stress and cause a flight to safe-haven assets like the DXY or the immediate need for dollar redemptions to meet payments.
The 10-2 year treasury has been inverted twice this year, and its significance is a reliable leading indicator of an impending recession. In August, it almost tagged -50bps, which is worse than the global financial crisis and the 2000 recession. A few more basis points lower, and it’ll be the deepest inversion since 1981.
Many macro experts are waiting for another indicator to invert: the 10-year-3-month spread. The spread is currently at 14bps; experts believe this is the accurate recession signal. The inversion of each yield curve has presaged every recession going back more than 40 years, and a recession usually occurs within the next six-twelve months.
Bitcoin Overview
The price of Bitcoin (BTC) in USD. Bitcoin Price $19,740 -10.44% (5D)
The measure of Bitcoin’s total market cap against the larger cryptocurrency market cap. Bitcoin Dominance 40.85% -0.05% (5D)
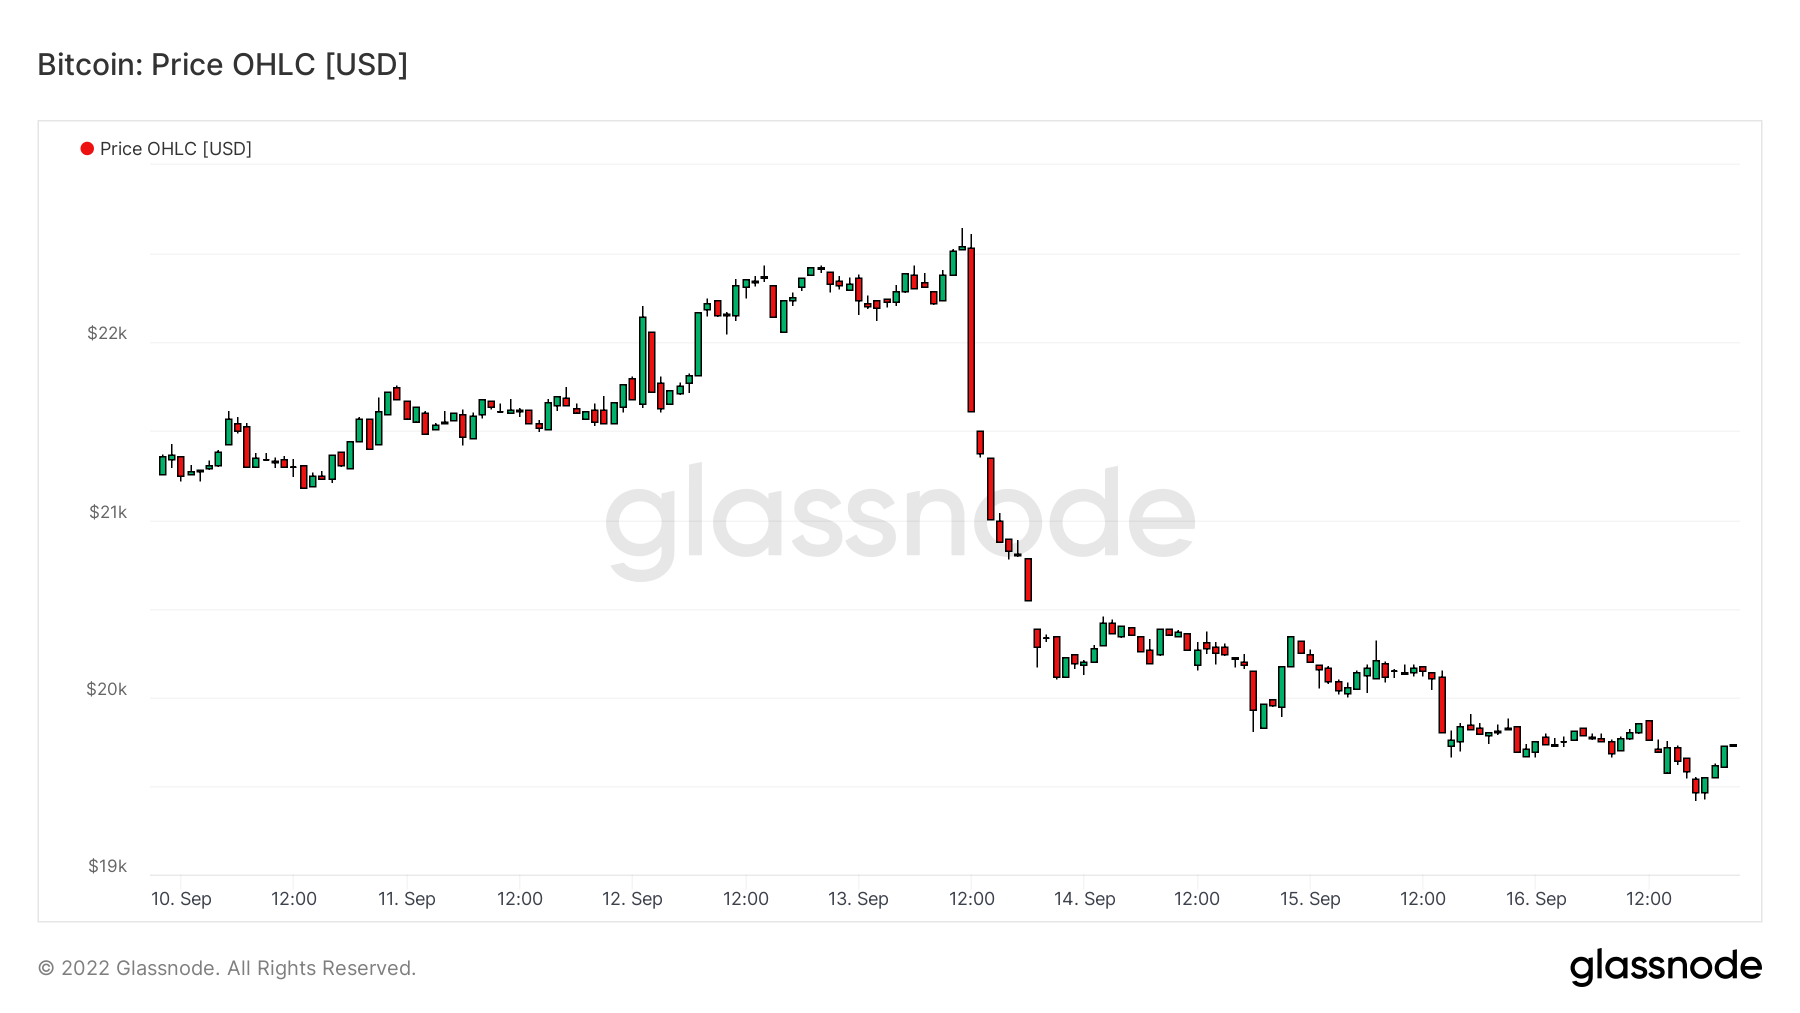
- Week commencing Sept. 12, Bitcoin spent most of its time under its realized price (cost basis, $21,400)
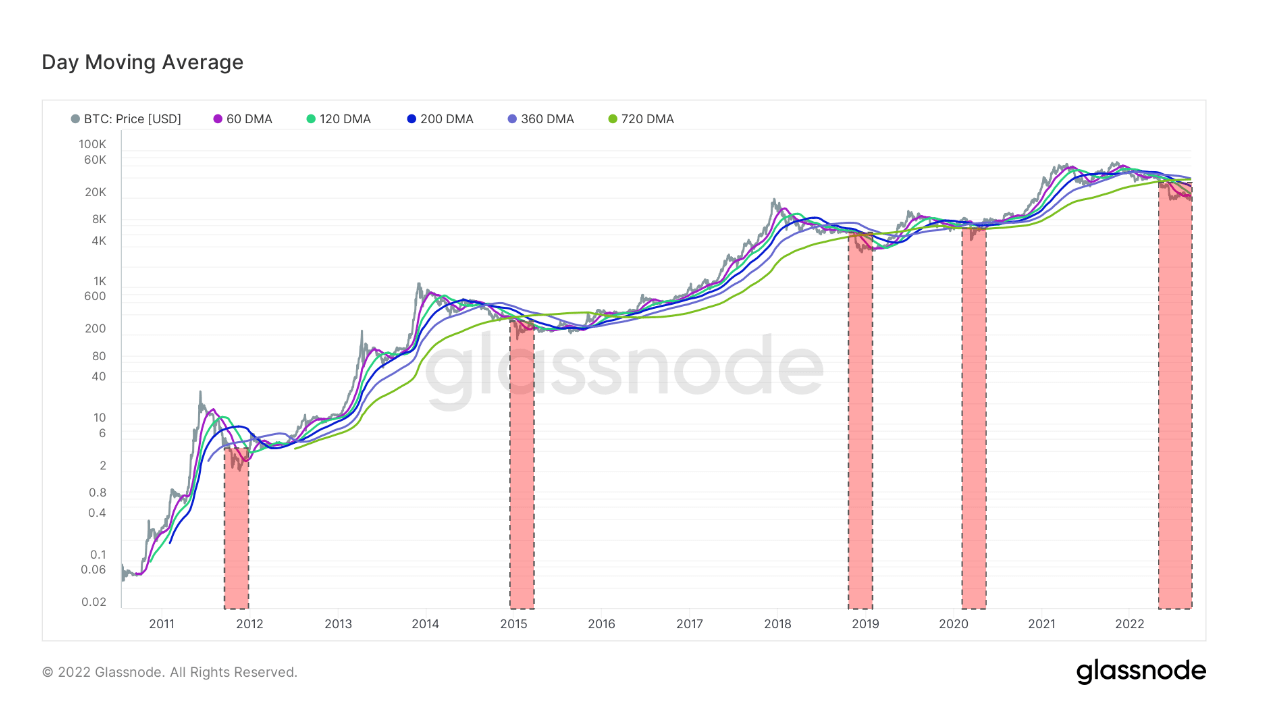
- Bitcoin is currently under all key moving averages fifth time in its history.
- Bitcoin’s hash rate hits an all-time high
- Bitcoin difficulty adjustment hits all-time high
- The total Supply Held by Long-Term Holders has reached a new ATH.
Addresses
Collection of core address metrics for the network.
The number of unique addresses that were active in the network either as a sender or receiver. Only addresses that were active in successful transactions are counted. Active Addresses 953,634 -7.73% (5D)
The number of unique addresses that appeared for the first time in a transaction of the native coin in the network. New Addresses 438,005 -3.50% (5D)
The number of unique addresses holding 1 BTC or less. Addresses with ≥ 1 BTC 902,250 0.08% (5D)
The number of unique addresses holding at least 1k BTC. Addresses with Balance ≤ 1k BTC 2,134 -0.19% (5D)
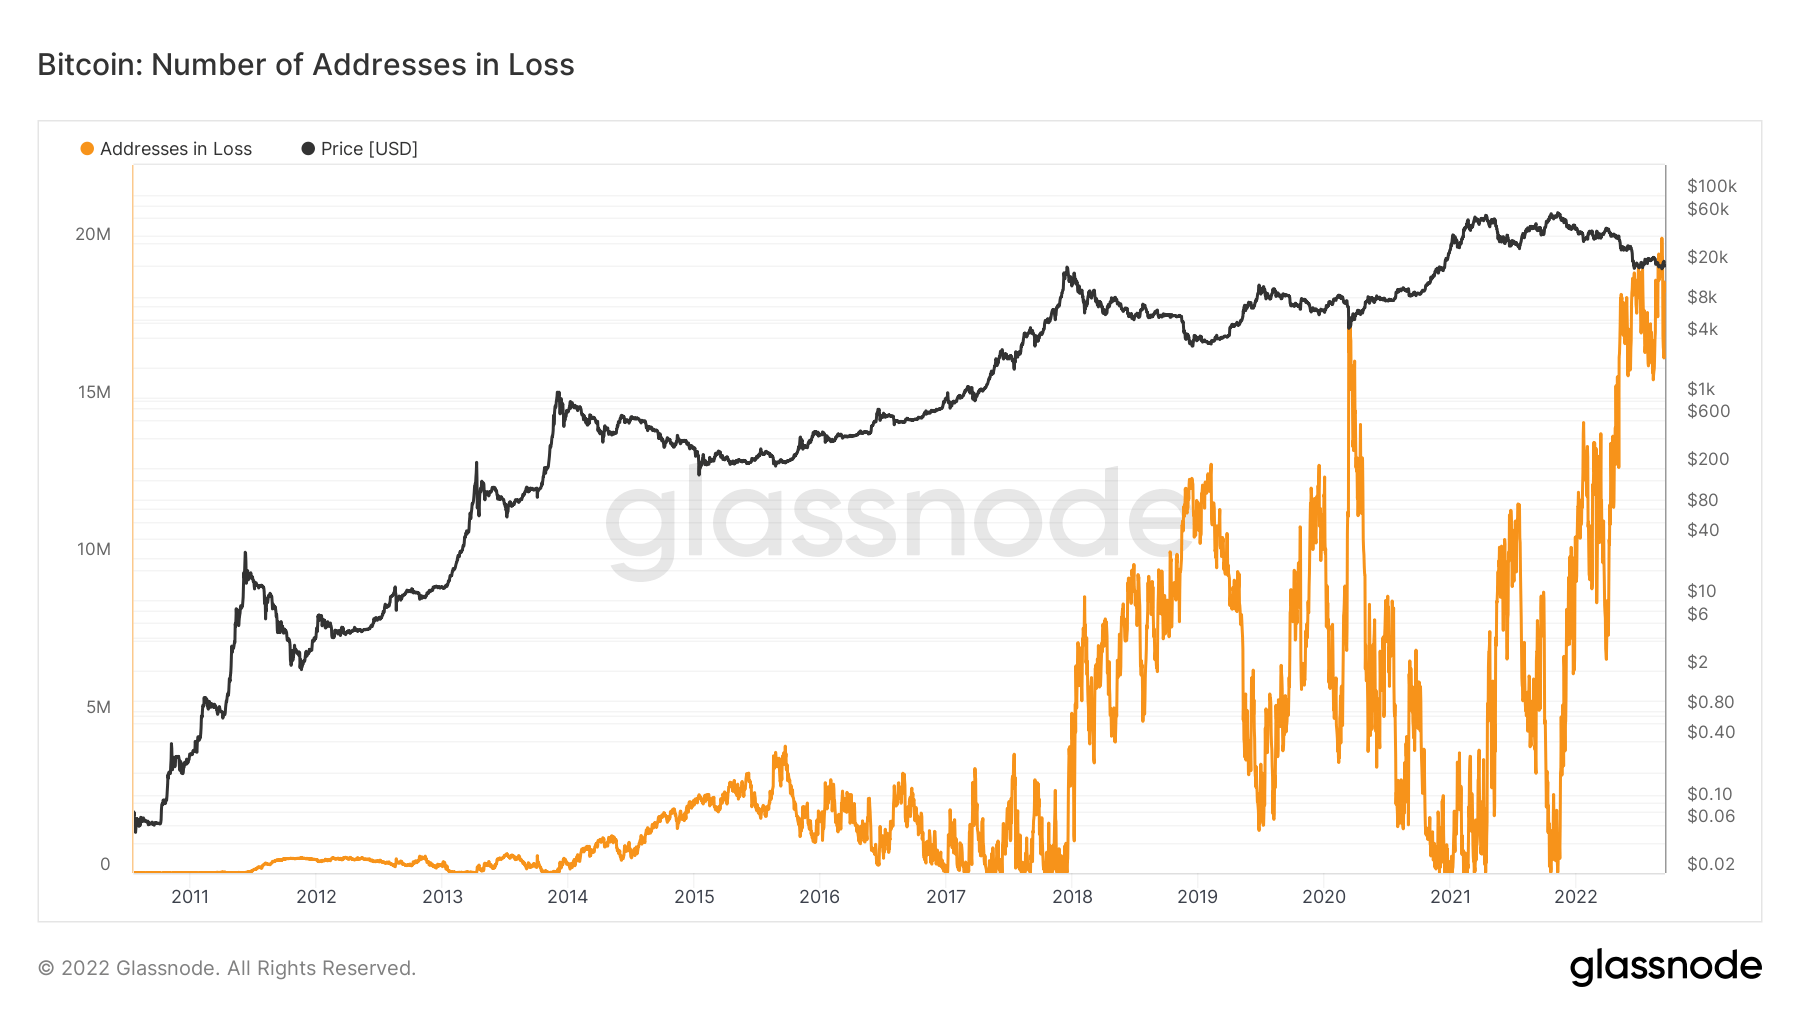
Over 20M addresses in loss
The number of unique addresses whose funds have an average buy price higher than the current price. “Buy price” is defined as the price when coins are transferred to an address.
Sept. 5 saw addresses in loss surpass 20 million for the first time since Bitcoin’s inception, showing how deep the 2022 bear market has been. Throughout 2022, addresses in loss started at under 10 million. It has doubled since January, which shows the severity of this bear market, as Bitcoin was over $45,000 at the beginning of January, just over a 50% drop in price.
Entities
Entity-adjusted metrics use proprietary clustering algorithms to provide a more precise estimate of the actual number of users in the network and measure their activity.
The number of unique entities that were active either as a sender or receiver. Entities are defined as a cluster of addresses that are controlled by the same network entity and are estimated through advanced heuristics and Glassnode’s proprietary clustering algorithms. Active Entities 283,087 11.80% (5D)
The number of BTC in the Purpose Bitcoin ETF. Purpose ETF Holdings 23,679 -0.10% (5D)
The number of unique entities holding at least 1k BTC. Number of Whales 1,703 0.18% (5D)
The total amount of BTC held on OTC desk addresses. OTC Desk Holdings 4,031 BTC -2.14% (5D)
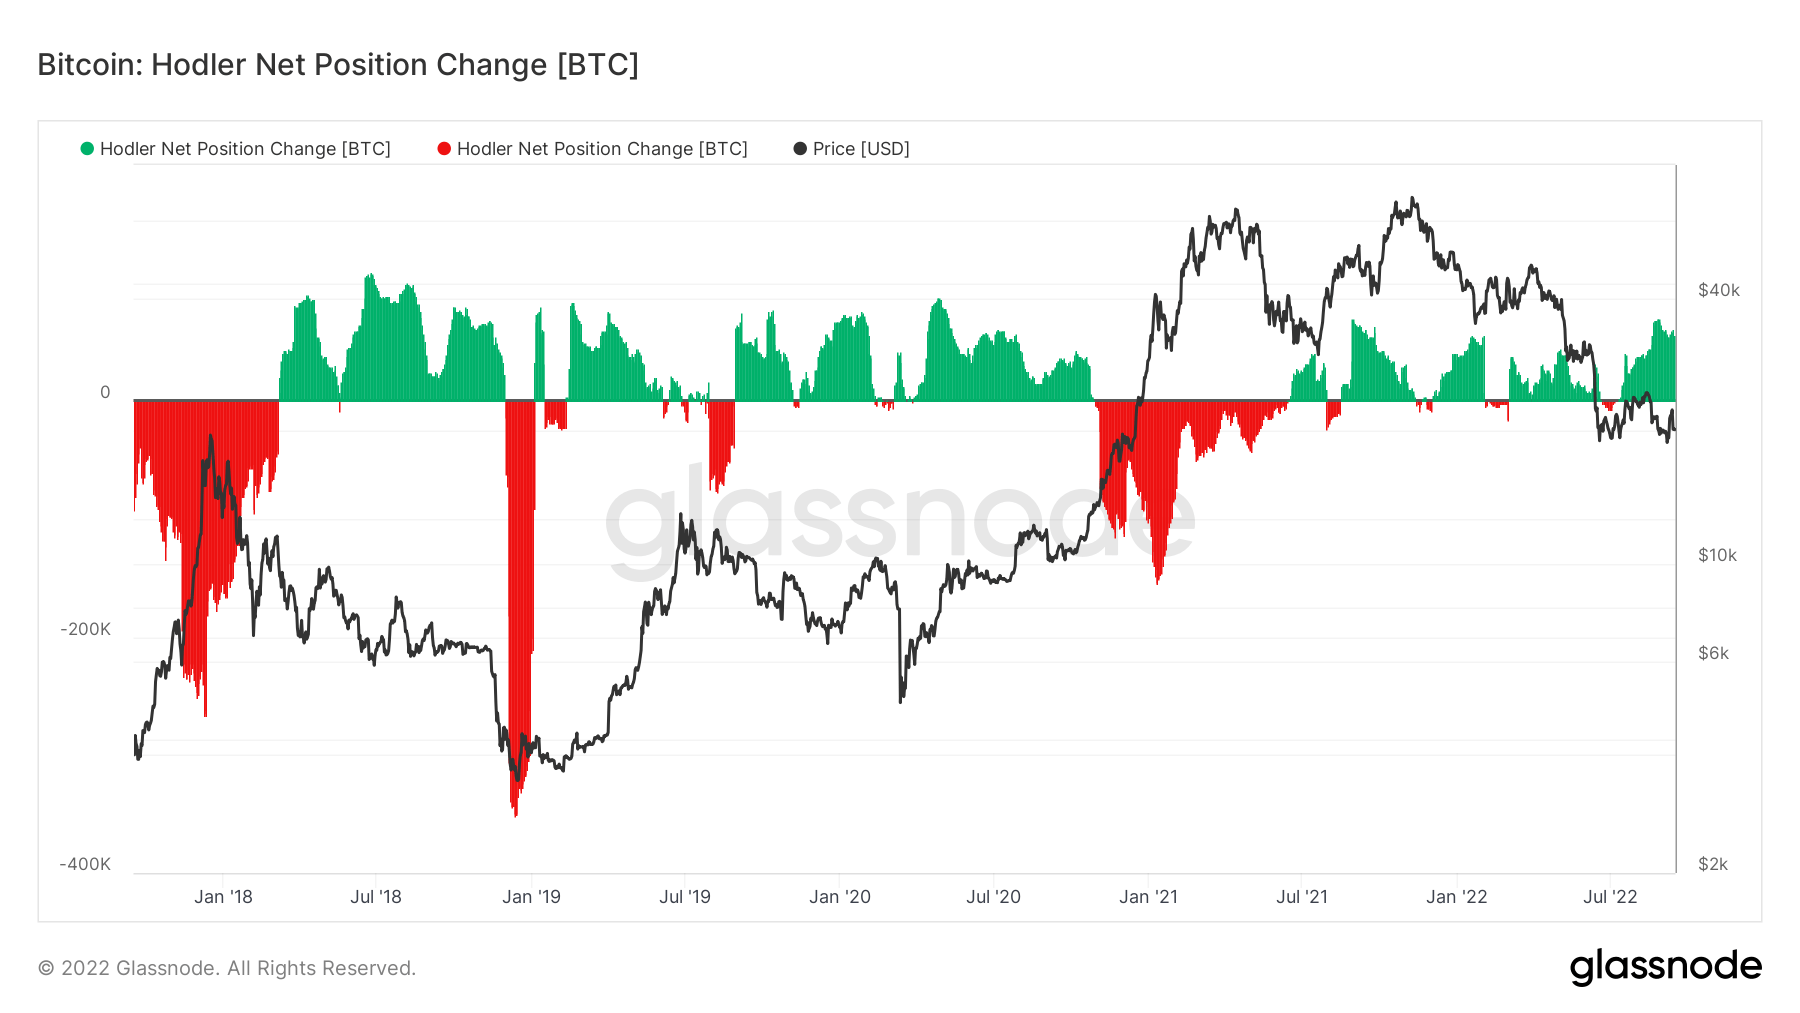
Bitcoin HODLers are unfazed by macro uncertainty
Assessing the levels of accumulation and distribution is essential to understanding over a long-term time frame. HODLers are an entity that has unwavering support and belief in Bitcoin.
Net position change looks at the supply dynamics and shows the monthly position change of long-term investors (HODLers). It indicates when HODLers cash out (negative) and when HODLers accumulate net new positions.
Looking at the period between November 2020 and March 2021, Bitcoin’s price appreciation grew dramatically. However, this saw a vast amount of HODLer distribution, with this cohort distributing at the top of the bull run in 2021, almost distributing over 200,000 coins to lock in profits.
However, since then, HODLers’ net position change has seen a dramatic increase in accumulation, currently witnessing over 70,000 BTC per month, one of the most significant amounts of accumulation since covid.
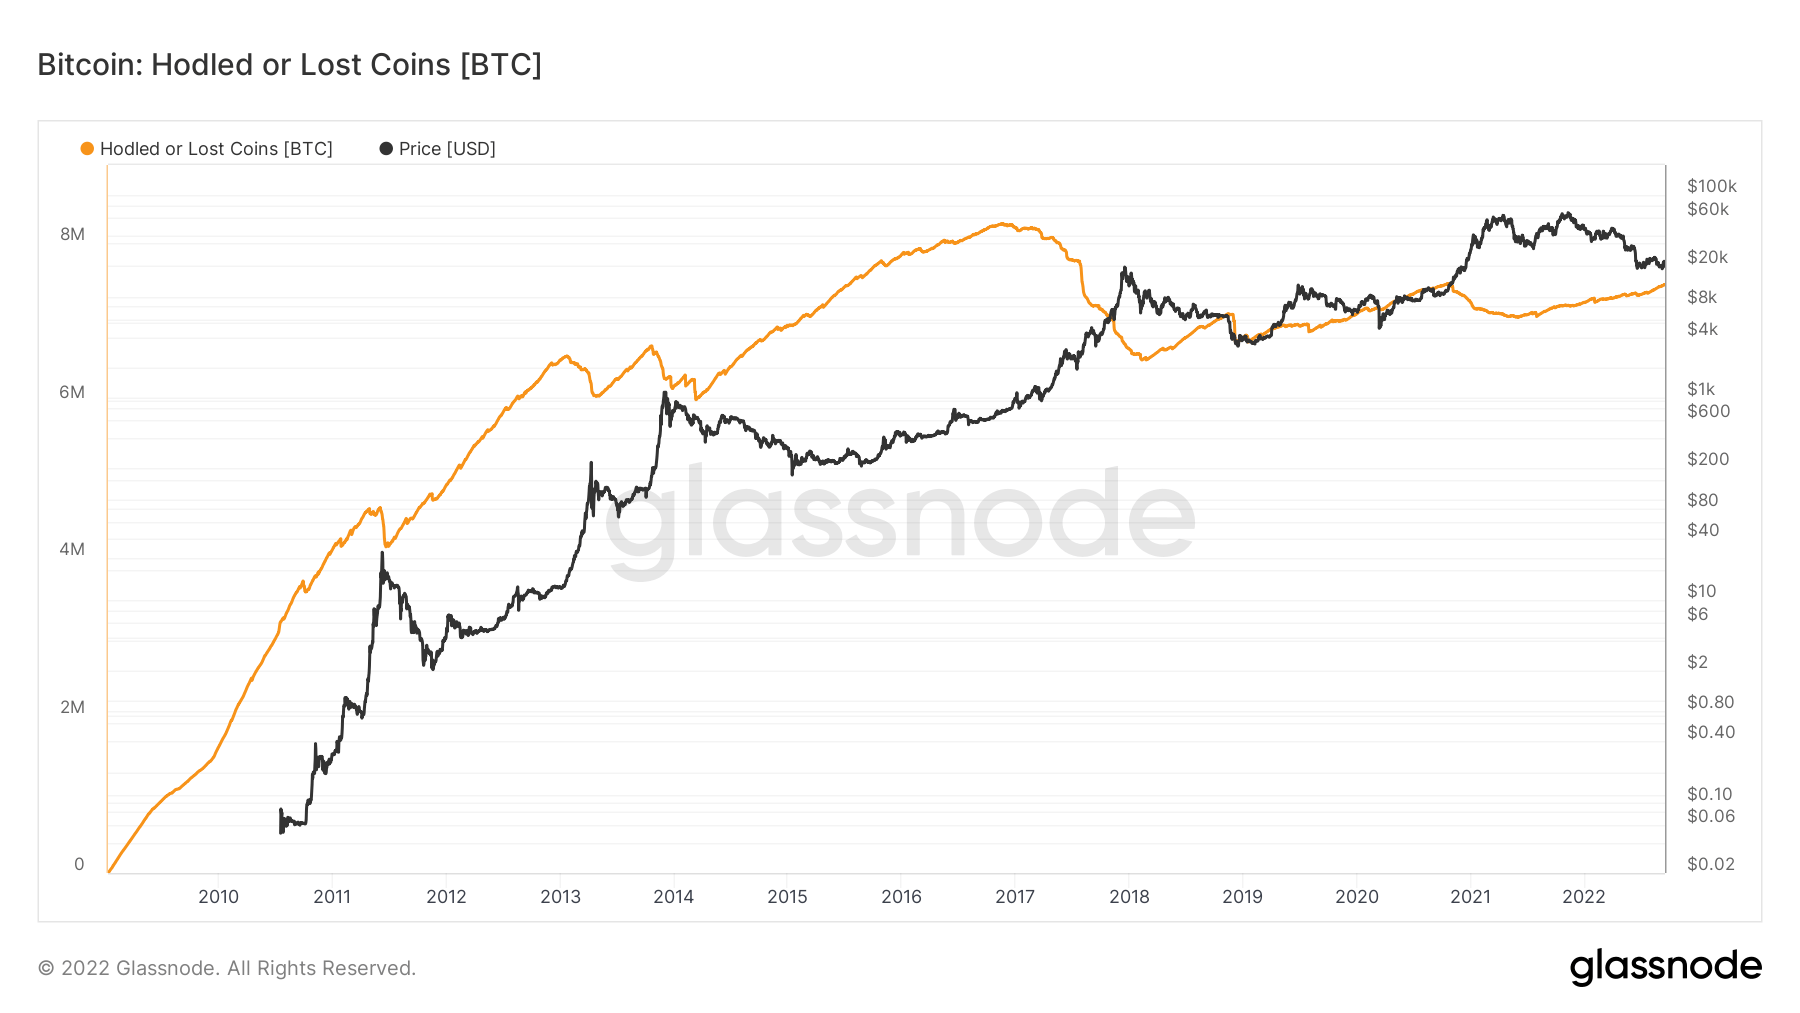
Glassnode estimates that almost 7.5 million coins (40% of the circulating supply) are being hodled or lost over time; they define lost or HODLed Bitcoins as moves of large and old stashes. It is calculated by subtracting Liveliness from 1 and multiplying the result by the circulating supply.
Dervatives
A derivative is a contract between two parties which derives its value/price from an underlying asset. The most common types of derivatives are futures, options and swaps. It is a financial instrument which derives its value/price from the underlying assets.
The total amount of funds (USD Value) allocated in open futures contracts. Futures Open Interest $10.95B -12.86% (5D)
The total volume (USD Value) traded in futures contracts in the last 24 hours. Futures Volume $33.29B $-38.48 (5D)
The sum liquidated volume (USD Value) from short positions in futures contracts. Total Long Liquidations $145.03M $35.61M (5D)
The sum liquidated volume (USD Value) from long positions in futures contracts. Total Short Liquidations $141.78M $105.8M (5D)
The dominant regime of puts throughout 2022
The Options 25 Delta Skew metric looks at the put vs. call options ratio expressed in Implied Volatility (IV). Puts are the right to sell a contract at a specific price, and calls are the right to buy.
For options with a specific expiration date, 25 Delta Skew refers to puts with a delta of -25% and calls with a delta of +25%, netted off to arrive at a data point. In other words, this is a measure of the option’s price sensitivity given a change in the spot Bitcoin price.
The particular periods refer to option contracts expiring one week, one month, three months, and six months, respectively.
Below 0 indicates calls are pricier than puts. This situation has occurred only six times this year. During Bitcoin’s recent bottoming, traders scrambled for puts and then reverted to calls at the local top.
Calls are pricier than puts for only the sixth time this year. Everyone scrambled for puts at the range bottom and then started to speculate on calls at the local top.

Apparent structural change in coin-backed margin
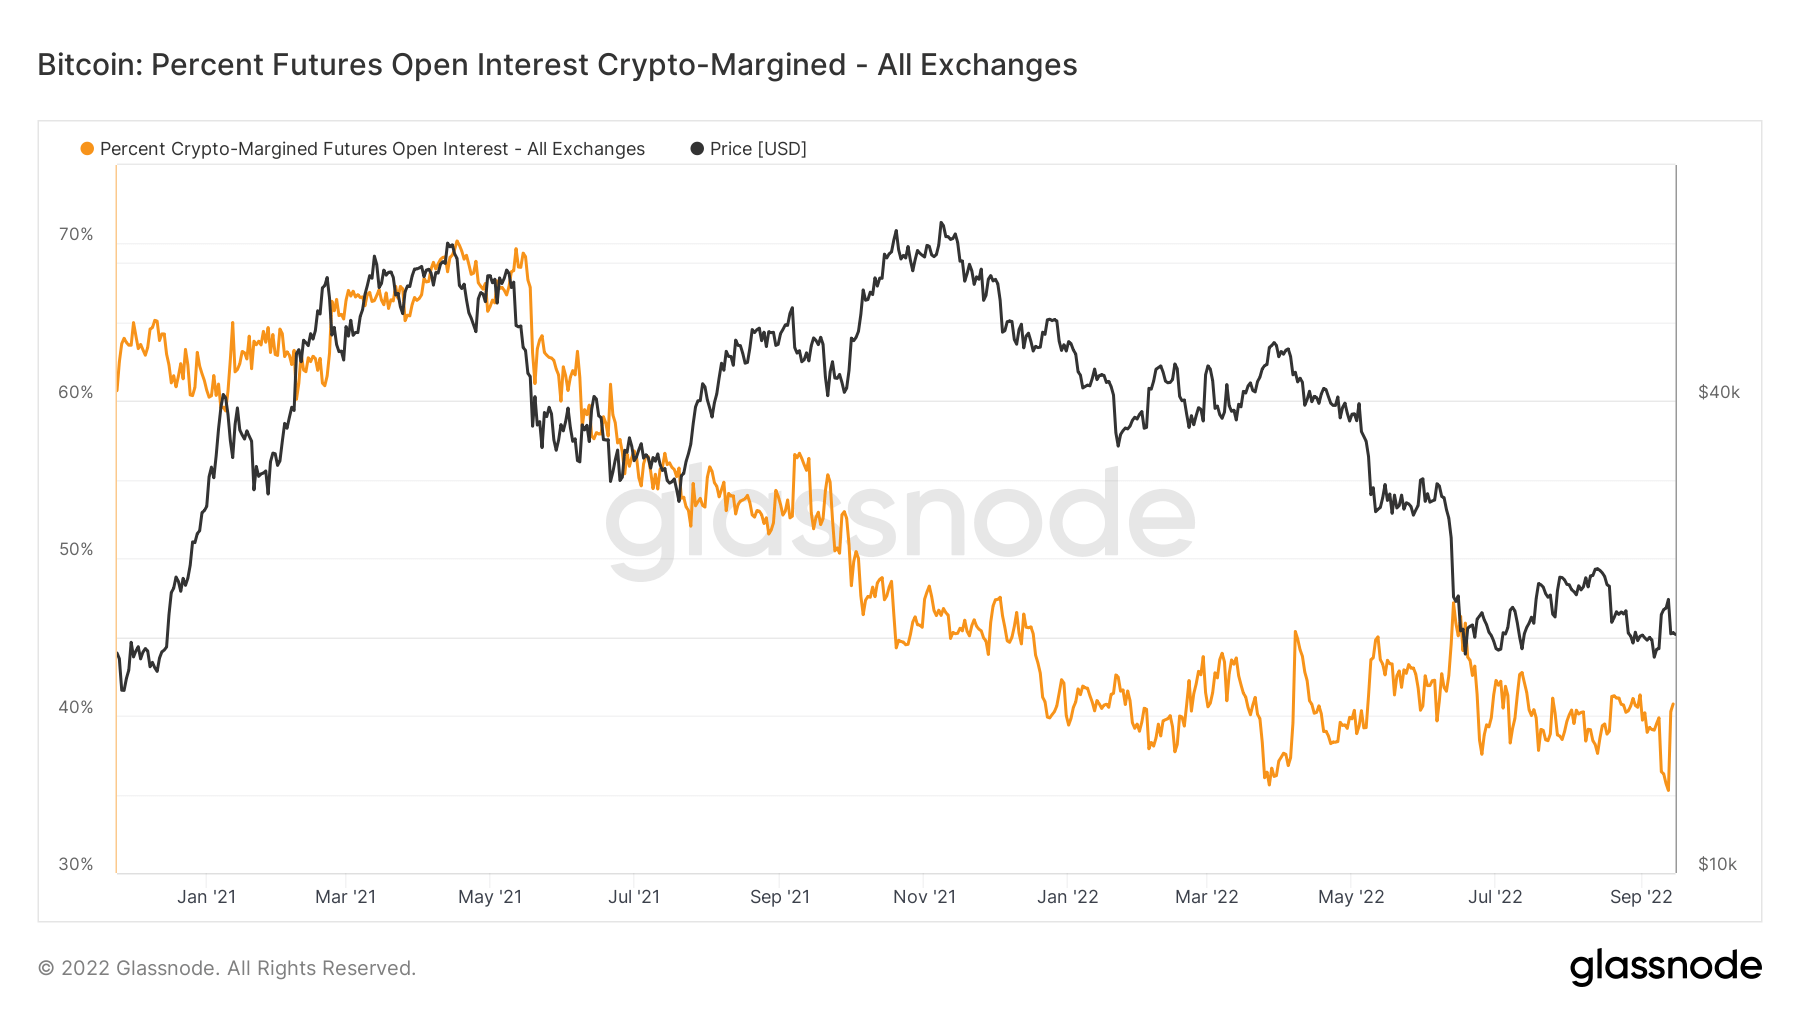
An explicit dynamic shift is occurring for crypto-margined futures open interest, which is the percentage of futures contracts open interest that is margined in the native coin (e.g., BTC), and not in USD or a USD-pegged stablecoin.
In May 2021, the coin-backed margin was at an all-time high of 70%; it is now at a mere 40%, a clear structural difference with investors taking much less risk in 2022. The other side of the coin is roughly 60% of the futures margin uses stablecoins or cash, which incurs a lot less volatility as the collateral value doesn’t change alongside the futures contract. As the margin is more stable, the price is relatively more stable. A theme that would be expected to remain this year.
Miners
Overview of essential miner metrics related to hashing power, revenue, and block production.
The average estimated number of hashes per second produced by the miners in the network. Hash Rate 235 TH/s 3.98% (5D)
The current estimated number of hashes required to mine a block. Note: Bitcoin difficulty is often denoted as the relative difficulty with respect to the genesis block, which required approximately 2^32 hashes. For better comparison across blockchains, our values are denoted in raw hashes. Difficulty 137 T 103.01% (14D)
The total supply held in miner addresses. Miner Balance 1,833,511 BTC -0.07% (5D)
The total amount of coins transferred from miners to exchange wallets. Only direct transfers are counted. Miner Net Position Change -40,559 BTC 18,947 BTC (5D)
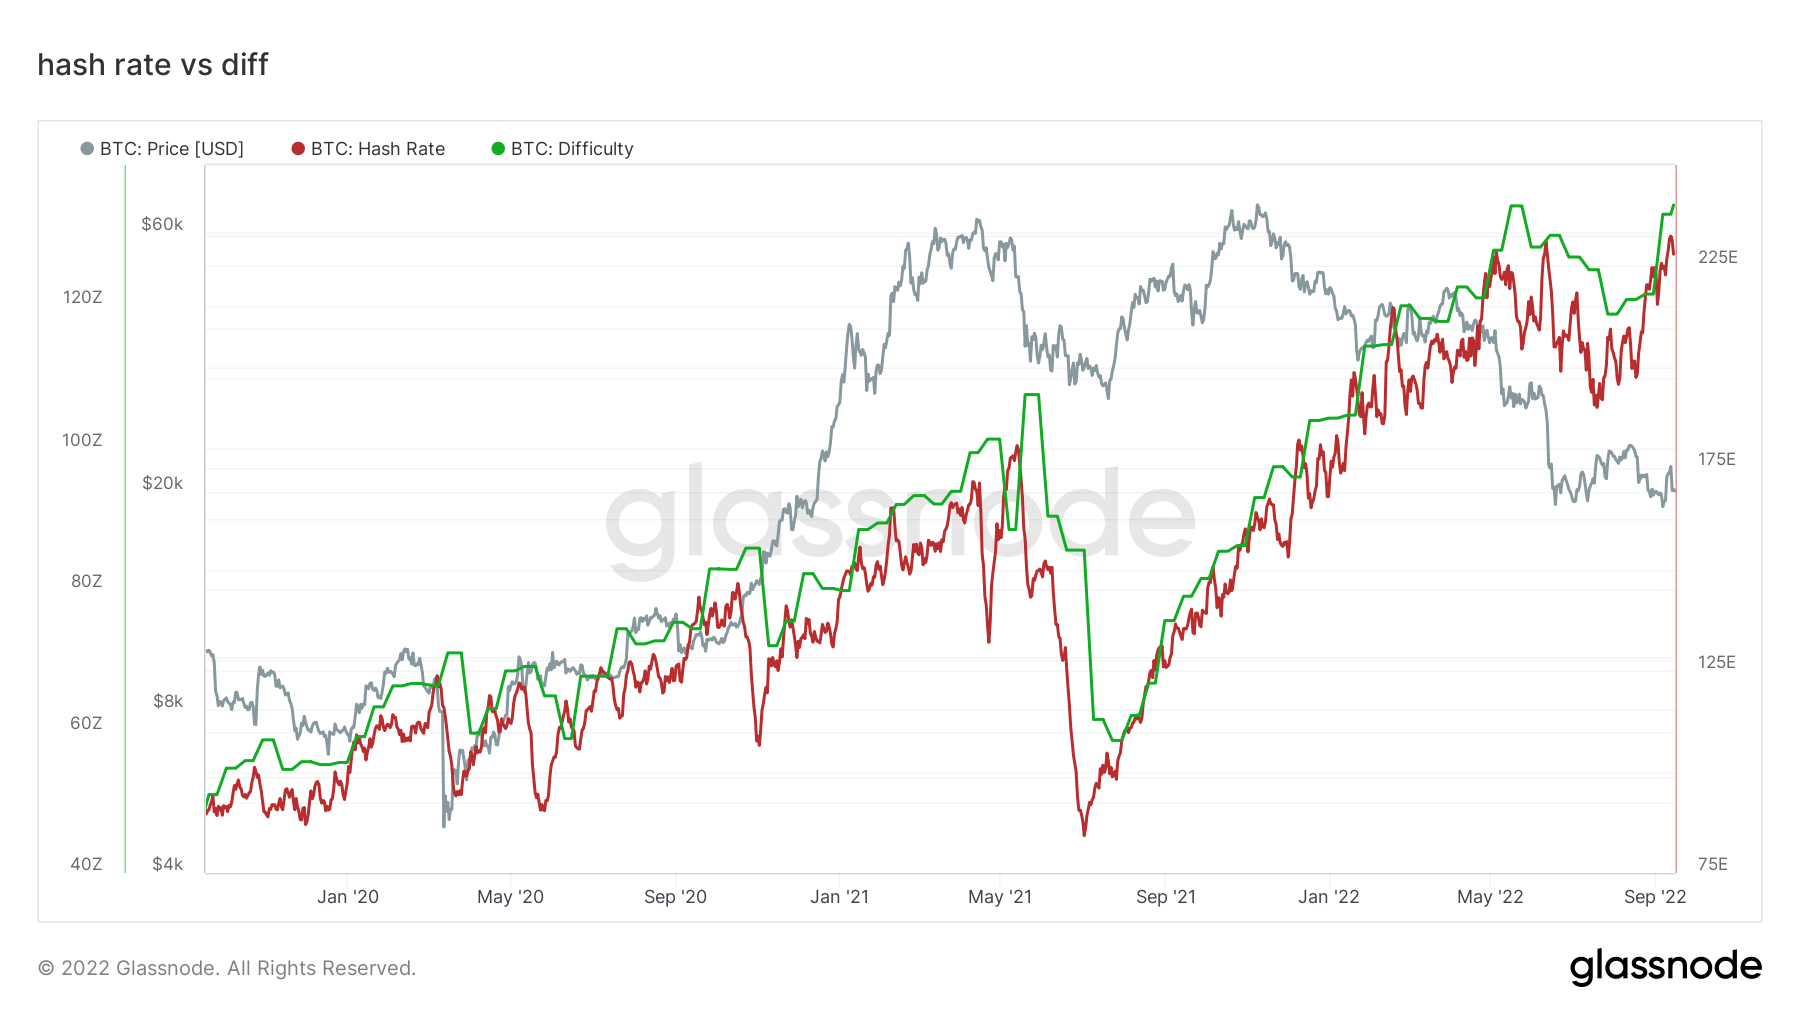
Hash rate and difficulty hit an all-time high
For the majority of September, CryptoSlate has discussed the repercussions of increasing difficulty for miners. Due to rising production costs and mining difficulty reaching an all-time high, miners saw falling revenues which would see unprofitable miners switch off from the network.
It is incredible to see the network’s resilience from a hash rate perspective; only 16 months ago, the hash rate collapsed by over 50%; however, a couple of weeks later, it increased three-fold.
On-Chain Activity
Collection of on–chain metrics related to centralized exchange activity.
The total amount of coins held on exchange addresses. Exchange Balance 2,397,444 BTC 25,462 BTC (5D)
The 30 day change of the supply held in exchange wallets. Exchange Net Position Change -117,735 BTC 262,089 BTC (30D)
The total amount of coins transferred from exchange addresses. Exchange Outflows Volume 538,545 BTC 122 BTC (5D)
The total amount of coins transferred to exchange addresses. Exchange Inflows Volume 569,151 BTC 125 BTC (5D)
Over $1B of realized losses on Sept. 13
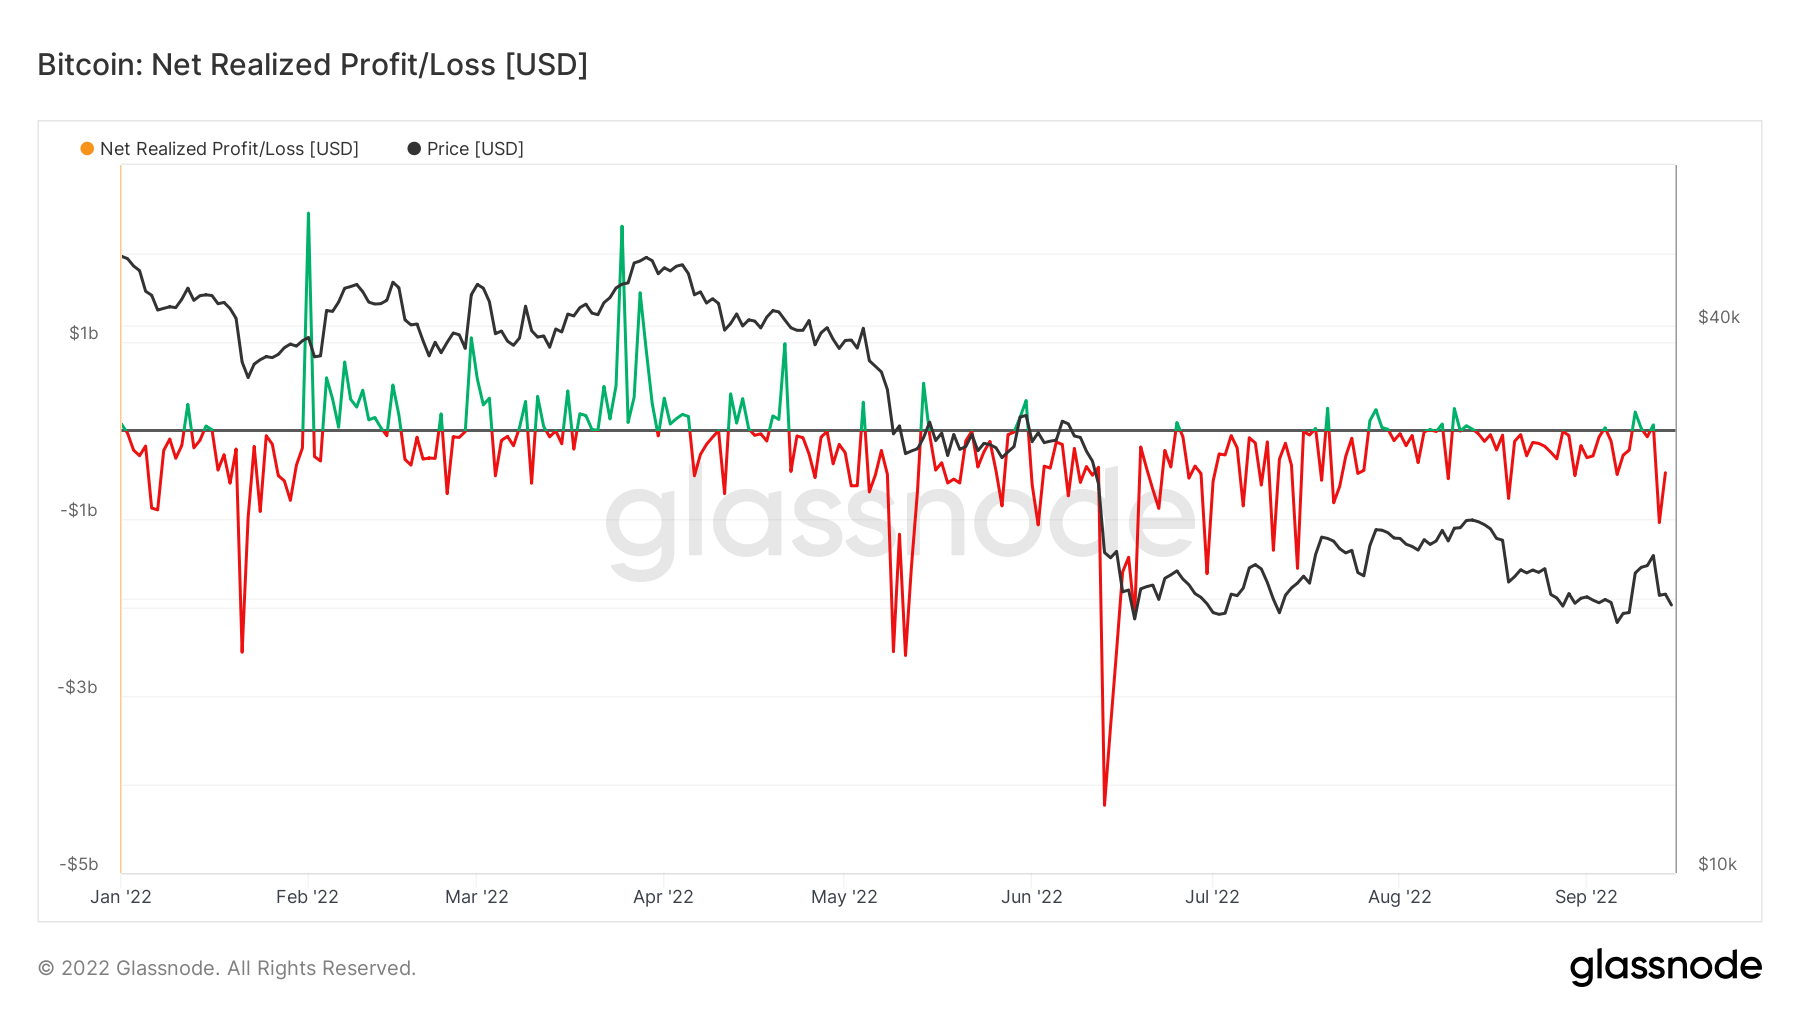
Net Realized Profit/Loss is the net profit or loss of all moved coins, and it is clear to see a regime of net losses for the second half of 2022 due to an unprecedented bear market. In mid-June, Bitcoin dipped below $18k, which saw a net realized loss of over $4 billion, the most ever.
However, on Sept. 13, Bitcoin dropped 10% to just under $20,000, which saw over $1 billion of realized losses. Investors are still treating Bitcoin as a tech stock and a risk-on asset, which has contributed to a significant amount of realized losses this year.
Supply
The total amount of circulating supply held by different cohorts.
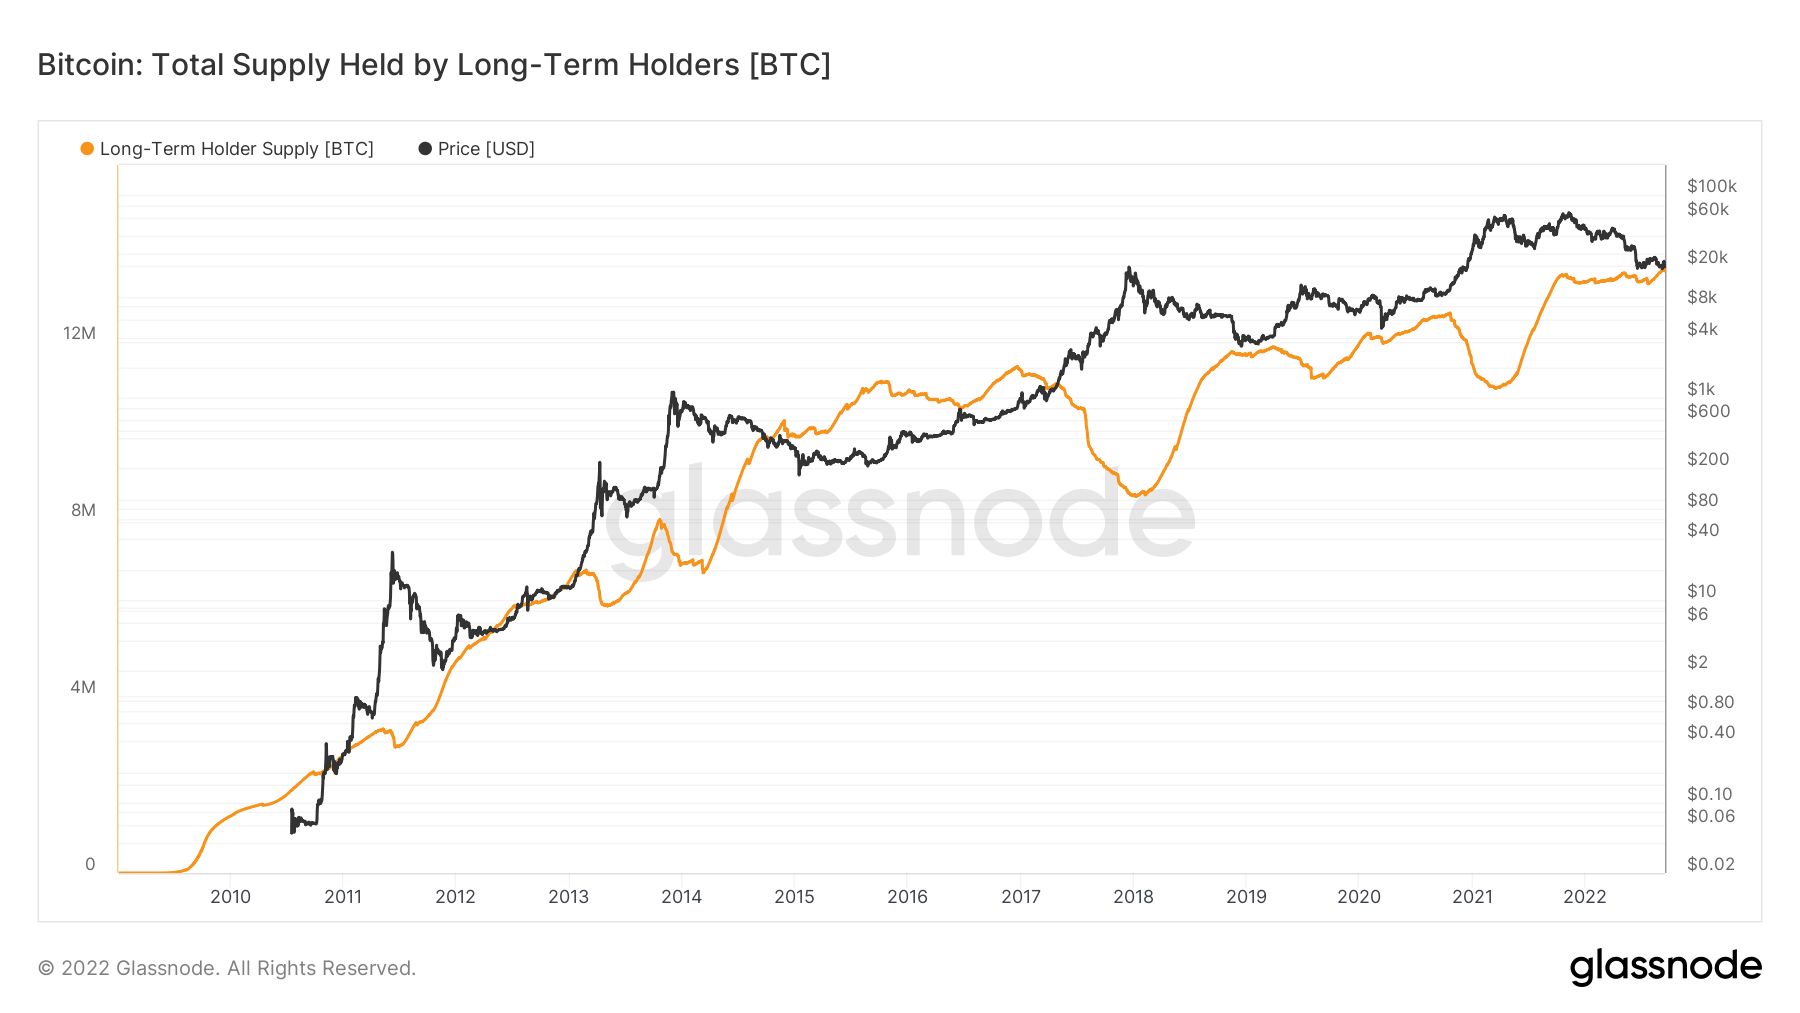
The total amount of circulating supply held by long term holders. Long Term Holder Supply 13.61M BTC 0.01% (5D)
The total amount of circulating supply held by short term holders. Short Term Holder Supply 3.1M BTC -0.77% (5D)
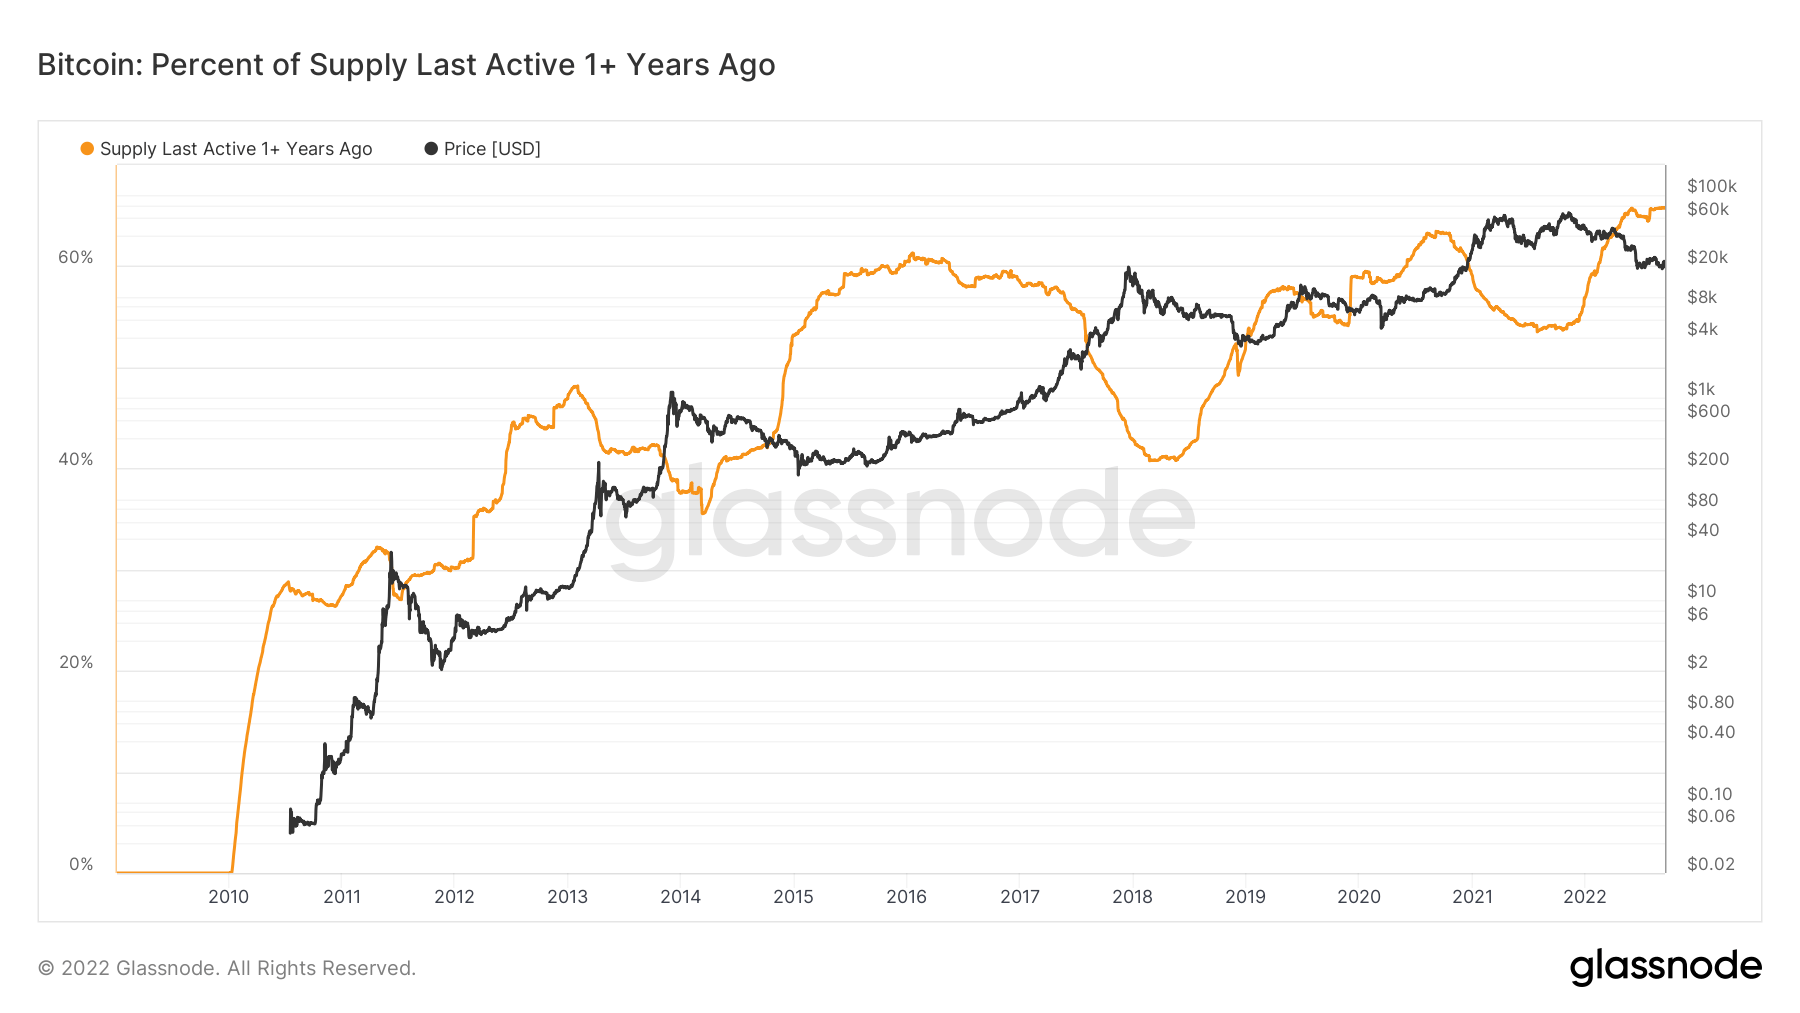
The percent of circulating supply that has not moved in at least 1 year. Supply Last Active 1+ Year Ago 66% 0.08% (5D)
The total supply held by illiquid entities. The liquidity of an entity is defined as the ratio of cumulative outflows and cumulative inflows over the entity’s lifespan. An entity is considered to be illiquid / liquid / highly liquid if its liquidity L is ≲ 0.25 / 0.25 ≲ L ≲ 0.75 / 0.75 ≲ L, respectively. Illiquid Supply 14.81M BTC -0.13% (5D)
Diamond hands for long-term investors
Supply last active 1+ year ago is defined as the percent of circulating supply that has not moved in at least one year. Since Bitcoin’s inception, this cohort has increased its supply ownership, holding over 65.8% of the supply.
Long-term holders are considered the smart money within the Bitcoin ecosystem; it is apparent that during bear markets, this cohort will accumulate aggressively while the price is suppressed and distributed into bull markets. This current cycle is no different than any of the others, as this cohort is currently accumulating, as their share of supply has increased this year, which is an encouraging sign.
This is further supported by the metric, total supply held by LTHs, currently holding over 13.6 million BTC, which is also at an all-time high. LTHs see massive value at these current BTC price levels adding to their supply during this bear market.
Cohorts
Breaks down relative behavior by various entities’ wallet.
SOPR – The Spent Output Profit Ratio (SOPR) is computed by dividing the realized value (in USD) divided by the value at creation (USD) of a spent output. Or simply: price sold / price paid. Long-term Holder SOPR 0.45 -26.23% (5D)
Short Term Holder SOPR (STH-SOPR) is SOPR that takes into account only spent outputs younger than 155 days and serves as an indicator to assess the behaviour of short term investors. Short-term Holder SOPR 0.98 -2.97% (5D)
The Accumulation Trend Score is an indicator that reflects the relative size of entities that are actively accumulating coins on-chain in terms of their BTC holdings. The scale of the Accumulation Trend Score represents both the size of the entities balance (their participation score), and the amount of new coins they have acquired/sold over the last month (their balance change score). An Accumulation Trend Score of closer to 1 indicates that on aggregate, larger entities (or a big part of the network) are accumulating, and a value closer to 0 indicates they are distributing or not accumulating. This provides insight into the balance size of market participants, and their accumulation behavior over the last month. Accumulation Trend Score 0.300 76.47% (5D)
The evolution of a HODLer
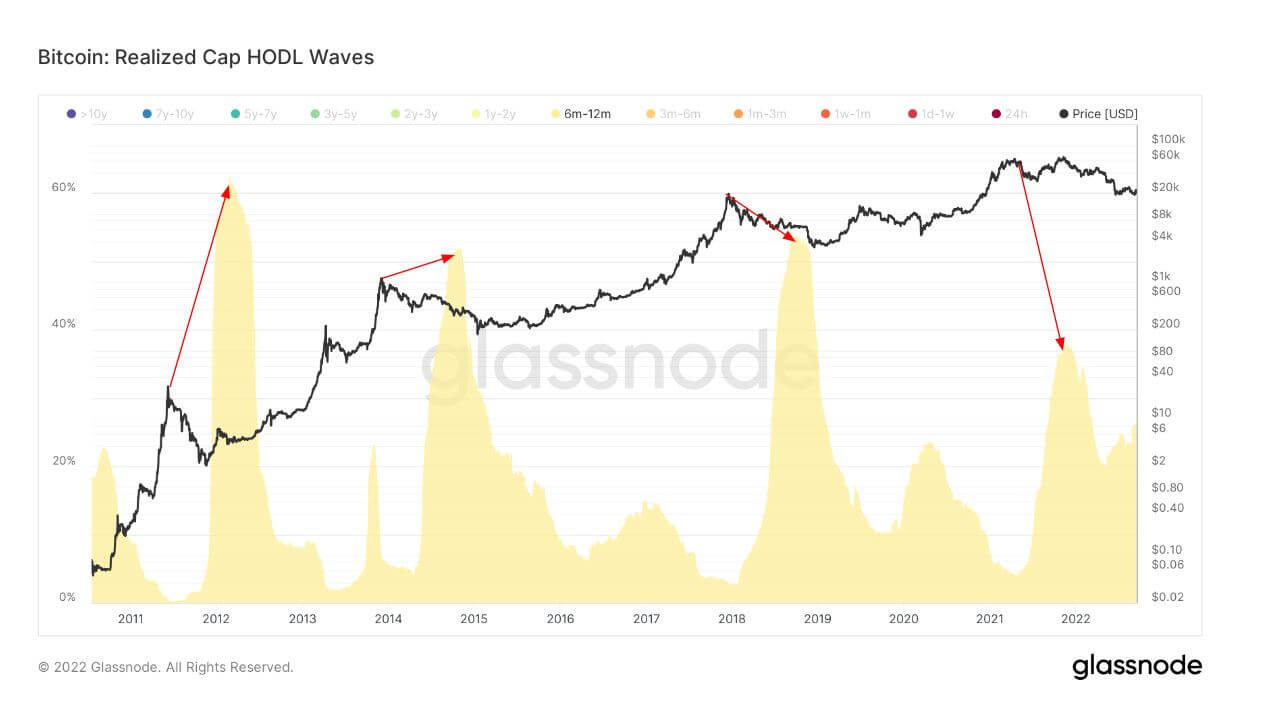
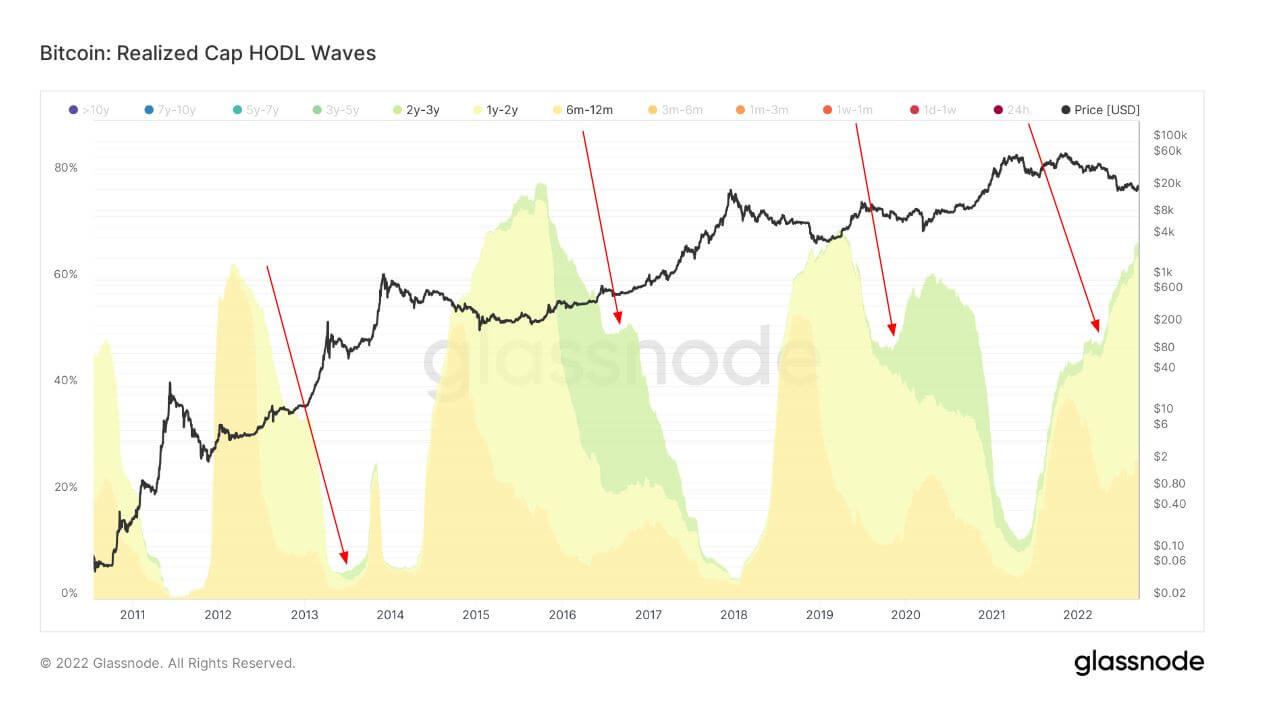
Bundle of all active supply age bands, aka HODL Waves. Each colored bar shows the percentage of Bitcoin that was last moved within the period denoted in the legend.
To understand the minds of LTHs, it is essential to understand their accumulation techniques. LTHs are investors who have held BTC for more than six months. The first graph shows six months to twelve-month holders.
The red arrows show the peak of this cohort’s holdings, which occurs roughly six months after the peak bull runs, as they have been drawn in by BTC’s exponential price appreciation; each cycle, this cohort holds around 40-60% of the BTC supply.
As the cohorts experience and knowledge grew within the BTC ecosystem, so did the supply of mature coins. The red arrows show the cohort from 6 to 12 months maturing into 1 to 2-year holders, weathering at least one bear market and significant price depreciation. Again, this cohort is roughly a year away from the peak of the bull run.
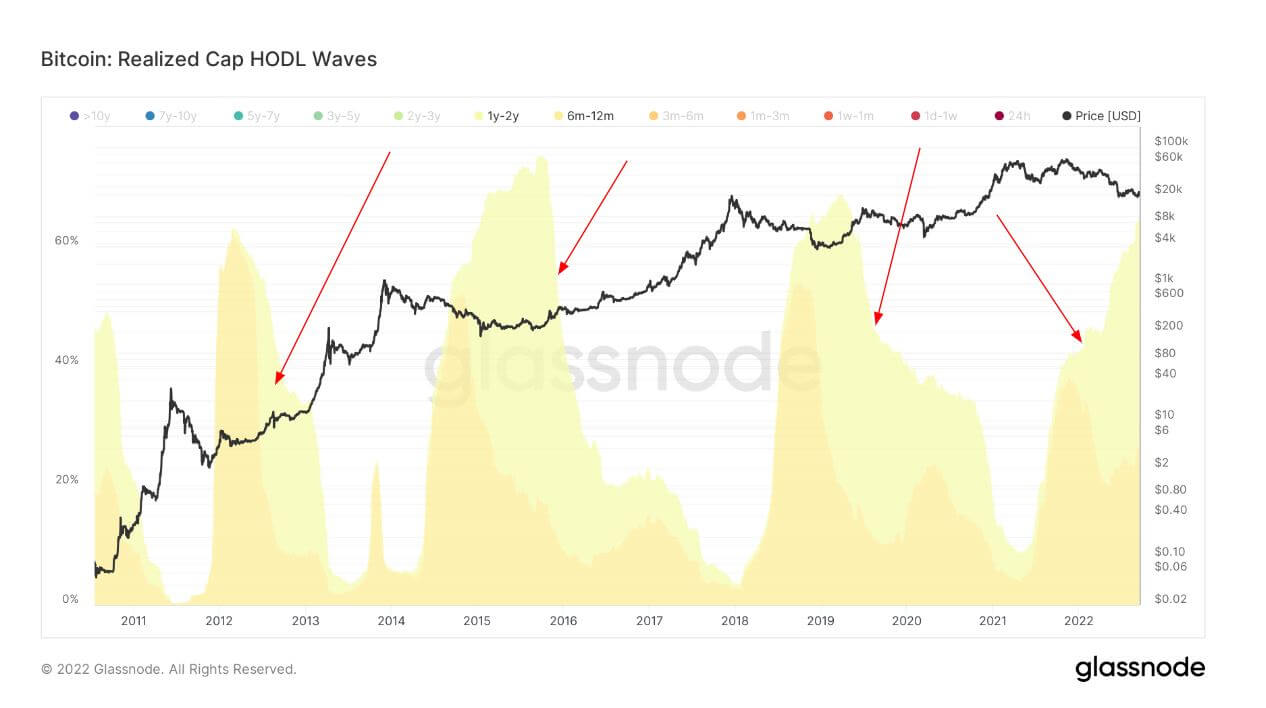
Lastly, the original cohort that bought the peak of the bull run eventually turned into 2-3 year holders who become experts within the ecosystem earning the right to be called “diamond hands.” This cohort doesn’t grow to the extent of the previous age bands, as not all investors make it that far but what can be deciphered is that this current cycle is no different from the previous ones. The 2- 3 year holders are starting to emerge in this cycle slowly, which is encouraging to see; it will be essential to keep an eye on this cohort to see if they mature as time passes.
Stablecoins
A type of cryptocurrency that is backed by reserve assets and therefore can offer price stability.
The total amount of coins held on exchange addresses. Stablecoin Exchange Balance $40.02B 6.92% (5D)
The total amount of USDC held on exchange addresses. USDC Exchange Balance $2.17B -11.56% (5D)
The total amount of USDT held on exchange addresses. USDT Exchange Balance $17.56B 6.92% (5D)
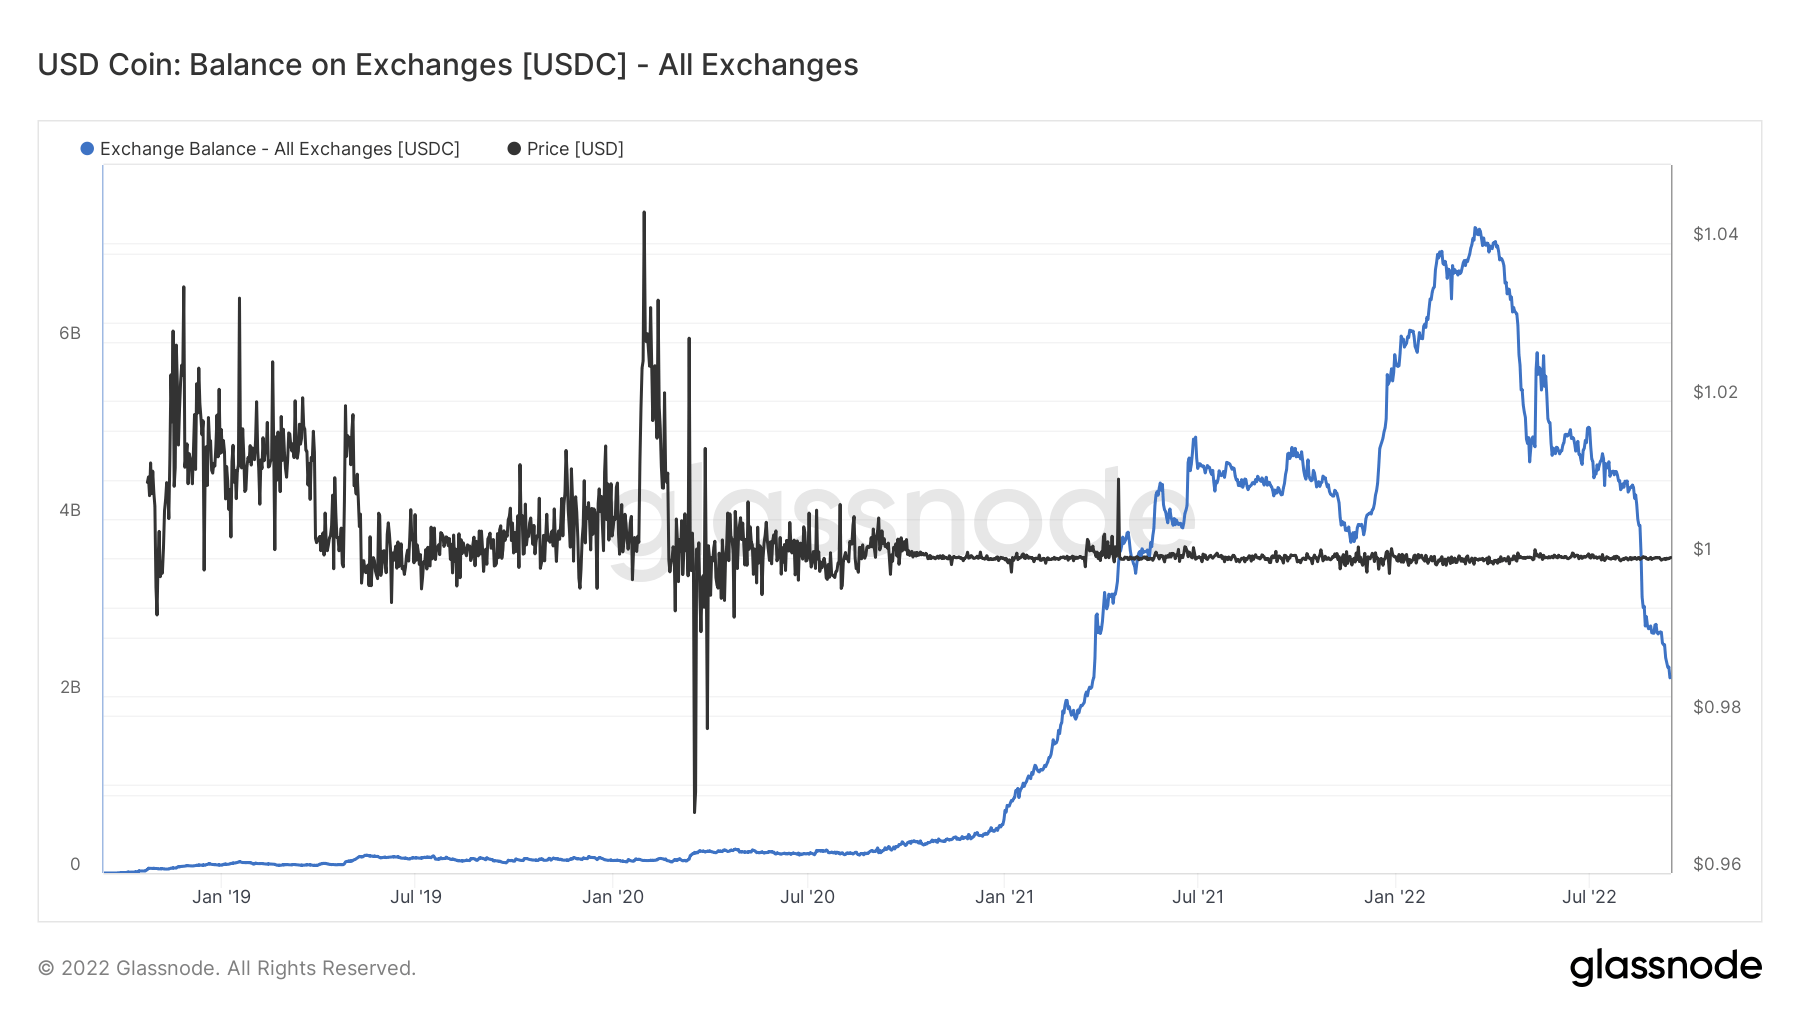
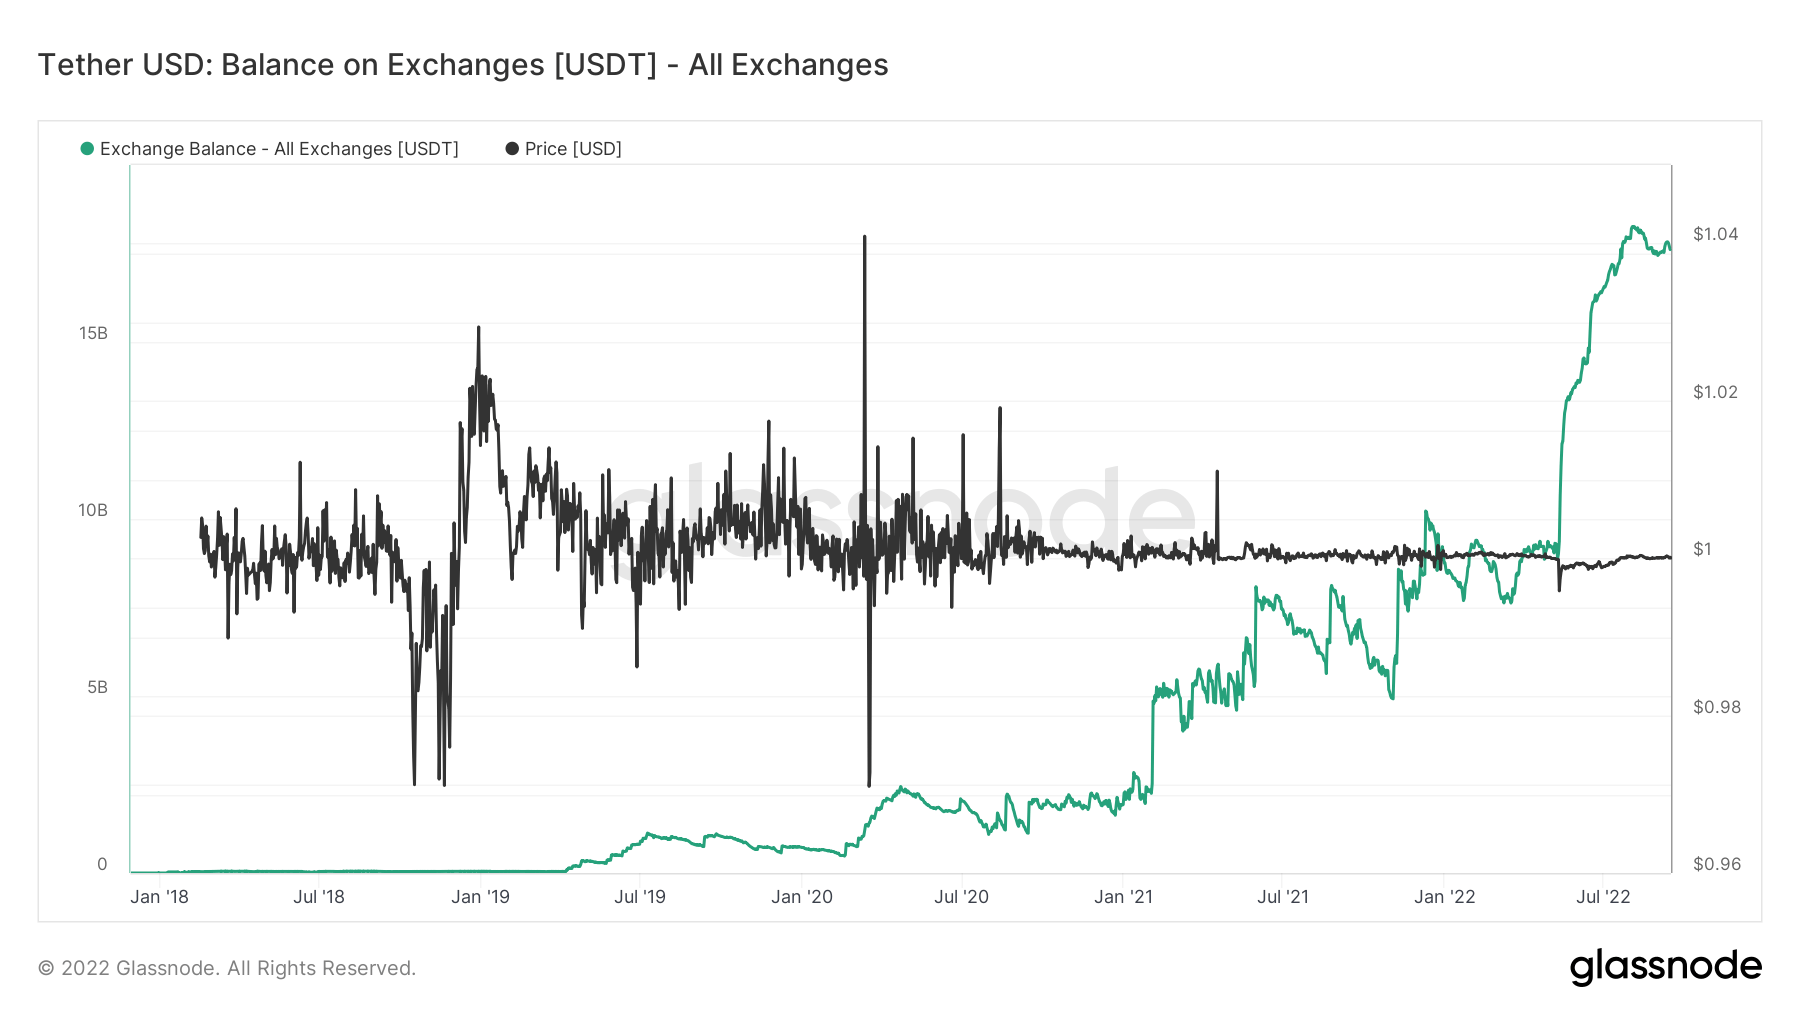
The divergence between USDC and USDT
“Dry powder” refers to the number of stablecoins available on exchanges held by investors who have acquired tokens such as USDC or USDT. The general assumption is high levels of stablecoins held on sales are a bullish sign for BTC as it shows a willingness to keep capital in the crypto markets until conditions change.
Significant divergence with balance on exchanges is occurring between USDC and USDT. USDC has come under some scrutiny recently, as Binance suspended withdrawals of USDC. A considerable amount of outflows occurred in 2022, just as USDC peaked in January with around $7 billion worth of stablecoins on exchanges.
However, USDT has only gone from strength to strength and has surpassed over $17 billion worth of stables on exchanges. Considering the amount of negative press USDT has received, it is still clearly the number one stablecoin for the time being.
Credit: Source link


")


 Bitcoin
  Ethereum
  Tether
  BNB
BNB  Solana
  USDC
USDC  XRP
XRP  Dogecoin
  Toncoin
  Cardano
  Shiba Inu
  Avalanche
  Wrapped Bitcoin
  Bitcoin Cash
  Polkadot
  Polygon
  Litecoin
  NEAR Protocol
  Uniswap
  LEO Token
  Aptos
Aptos  First Digital USD
  Filecoin
  OKB
OKB  Stellar
  Cosmos Hub
  Render
  Arbitrum
  Immutable
  Bittensor
  Hedera
  Maker
Maker  dogwifhat
  The Graph
  Injective
  Optimism
  Ethena USDe
  Fetch.ai
