
Macro Overview
Markets unprepared for a new era
The era of financial repression after the GFC that has seen rapidly inflated asset values and rate expectations of 0 has unraveled since the pandemic ended. Since the Second World War, the most significant fiscal stimulus package has contributed to supply chain failures and surges in goods and services. This has unleashed a wave of demand for services with labor that remains in short supply. Fixed income yields have surged to multi-year highs, and investors continue to flock to the dollar.
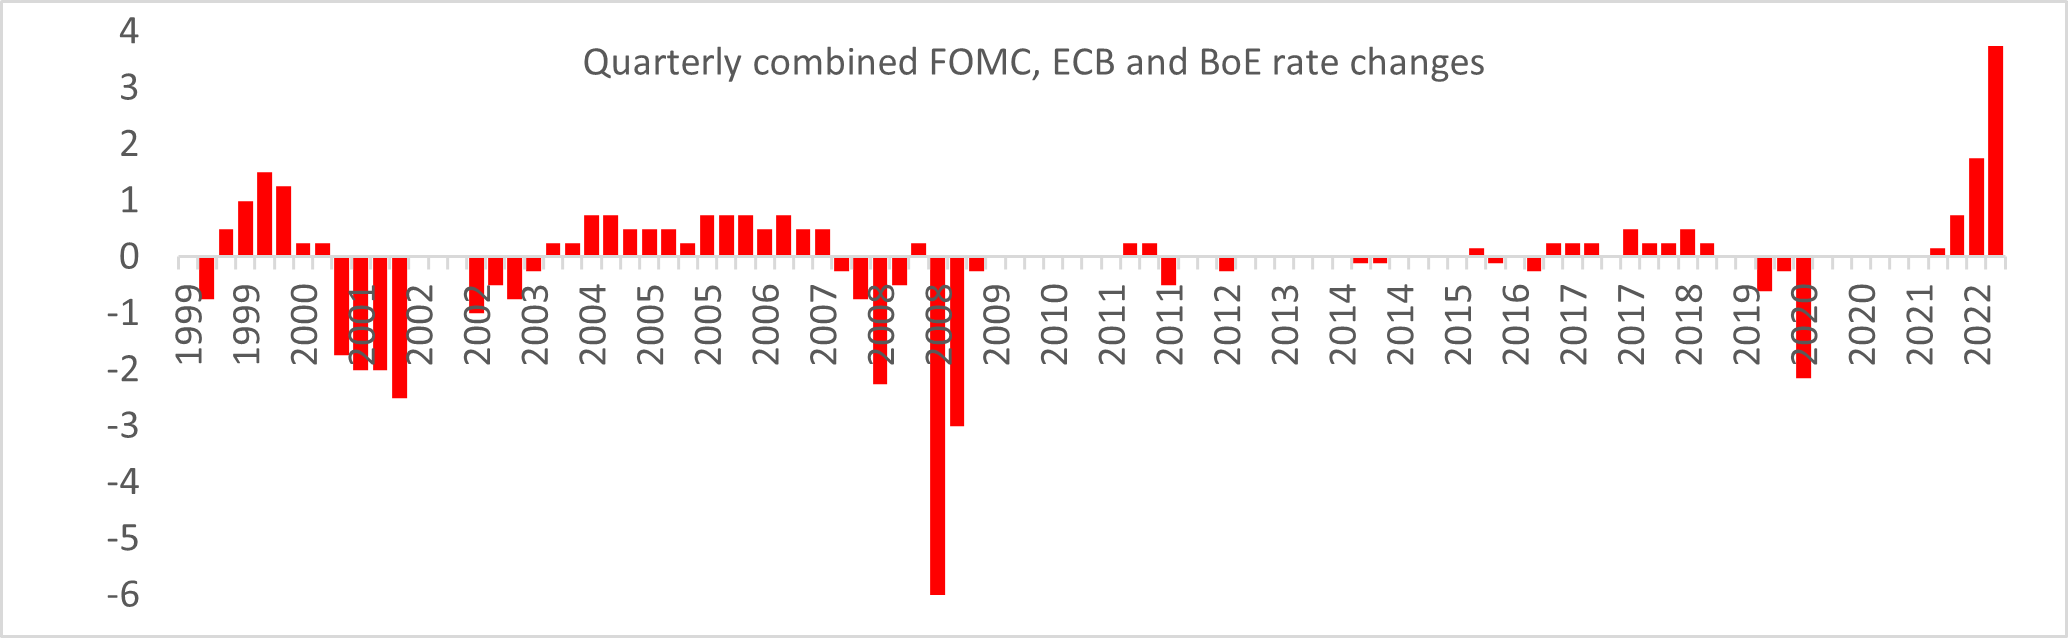
The old era has ended; central banks have kept interest rates at all-time lows for the past two decades and have been extremely slow to hike. However, since 1999, the combined moves from the FOMC, ECB, and BOE have had a combined rate change of 2% for September and 3.75% over the quarter. The most since the establishment of the ECB.
Is Credit Suisse the Lehman Brothers of this cycle?
Credit default swaps (CDS) may seem complicated and heard during the GFC back in 2008, but the CDS market is telling us something similar may be occurring in 2022.
History doesn’t repeat, but it often rhymes.
What are CDS? In layman’s terms, a swap is a contract between two parties agreeing to swap one risk for another. One party purchases protection from another party against losses from a borrower’s default.
With every swap, there is a ‘counterparty risk.’ During the housing crisis in 2008, Lehman Brothers went bankrupt and could not pay back the insurance they sold to investors. The owners of the CDS suffered a loss on the bonds that defaulted.
CDS is a good indicator of potential defaults; when the price of the CDS rises, the insurance becomes more expensive (higher elevated chance of default).
In recent times it hasn’t been so good for Credit Suisse (CS), a record trading loss, shuttered investment funds, multiple lawsuits, corporate scandal, and a new CEO. Poor performances have seen more than 10% of its 45,000 workforce fired while leaving the US market and splitting up its investment bank.
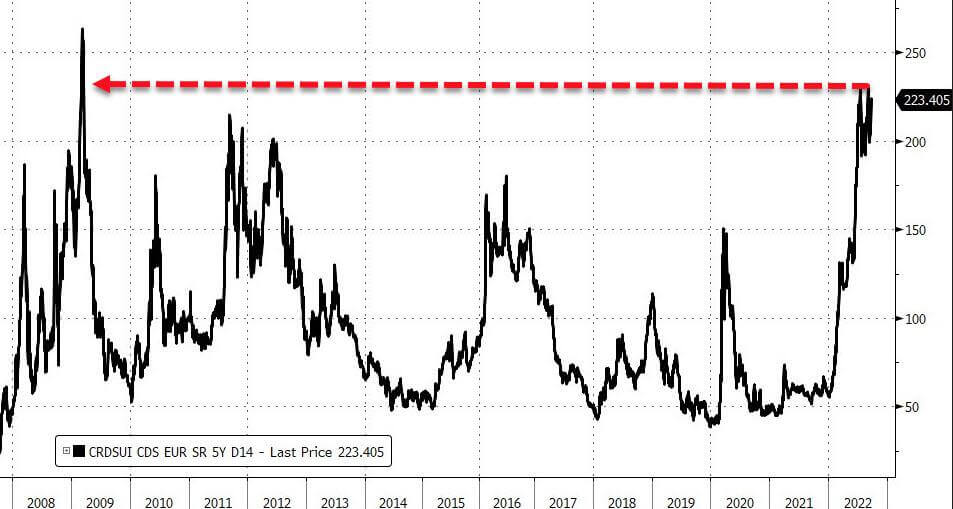
Default insurance on Credit Suisse is approaching the same level as during Lehman Brothers’ collapse.
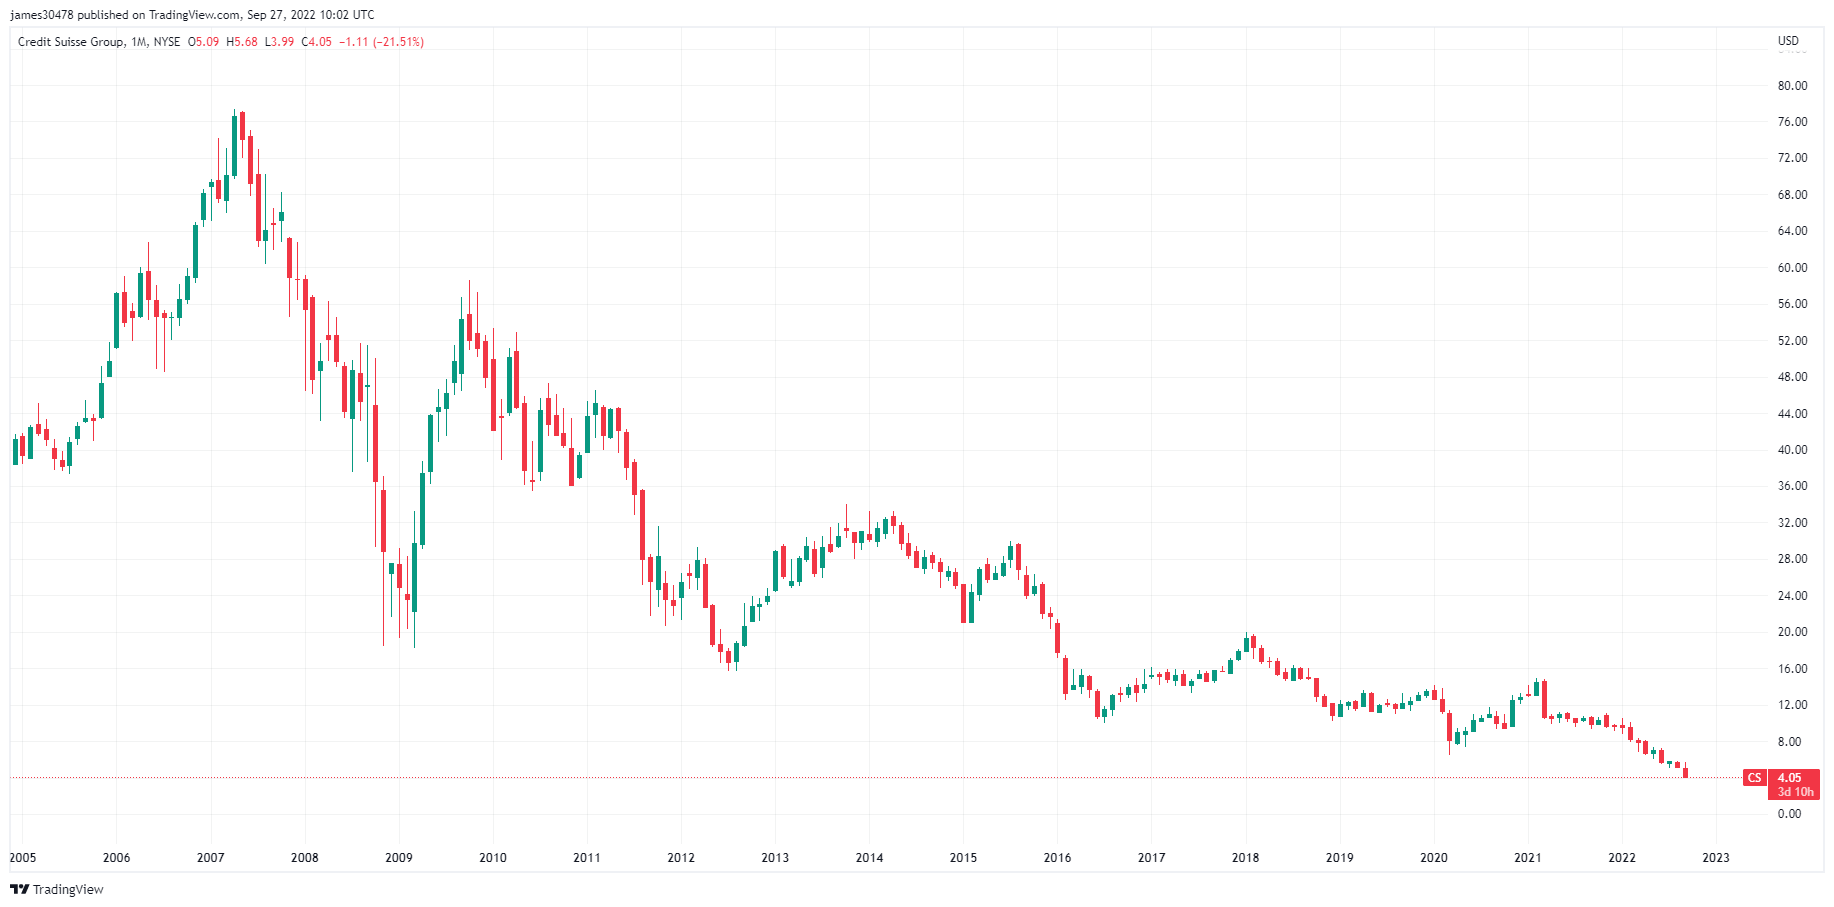
As a result of the above, the share price has tanked from $14.90 in February 2021 to $3.90 currently and is avoiding going to the market for funding due to its tumbling share price. CS has dropped below a quarter of its book value while its market cap is below its revenue.
Should you be concerned about your CS pension? Holding USD doesn’t mean a lot because all you have is an IOU from the bank if they go insolvent.
Many Bitcoiners believe BTC is the best protection against fiat failure due to the lack of counterparty risk. As long as you custody and store Bitcoin correctly, the Bitcoin is yours, and there is no default risk on the insurance you own. Unlike CDS, Bitcoin has no expiry option. In addition, it is also protected against hyperinflation due to its finite supply.
Correlations
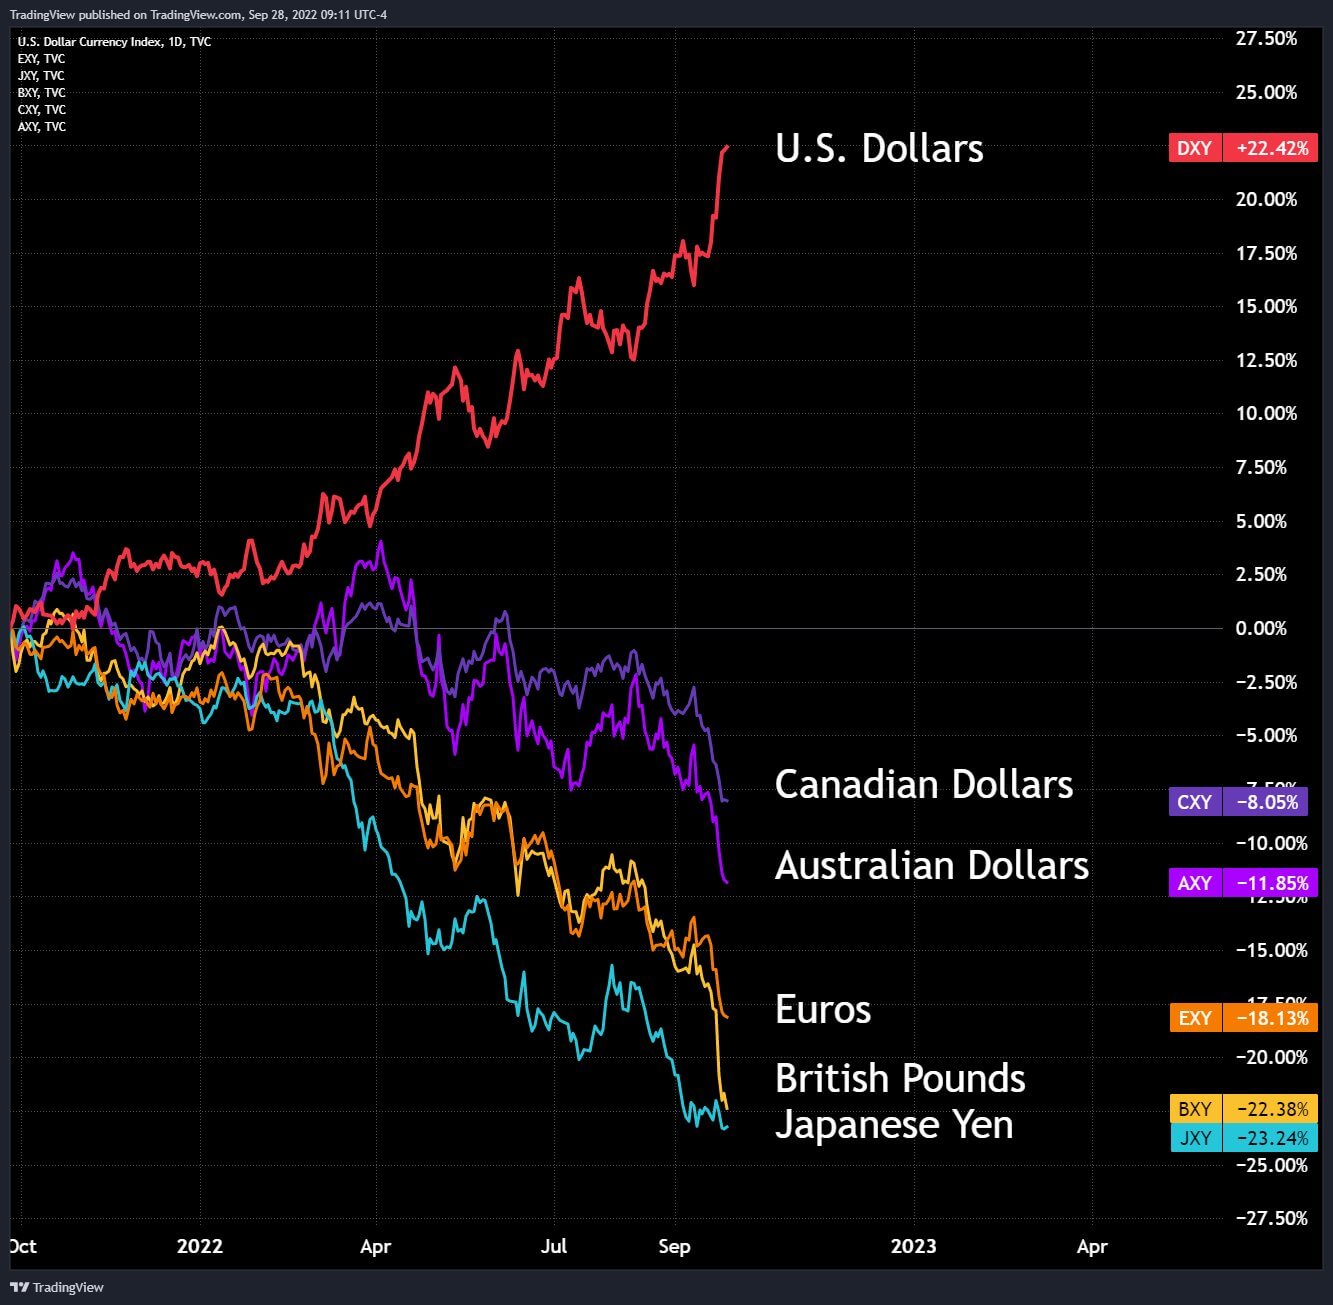
DXY wrecking ball
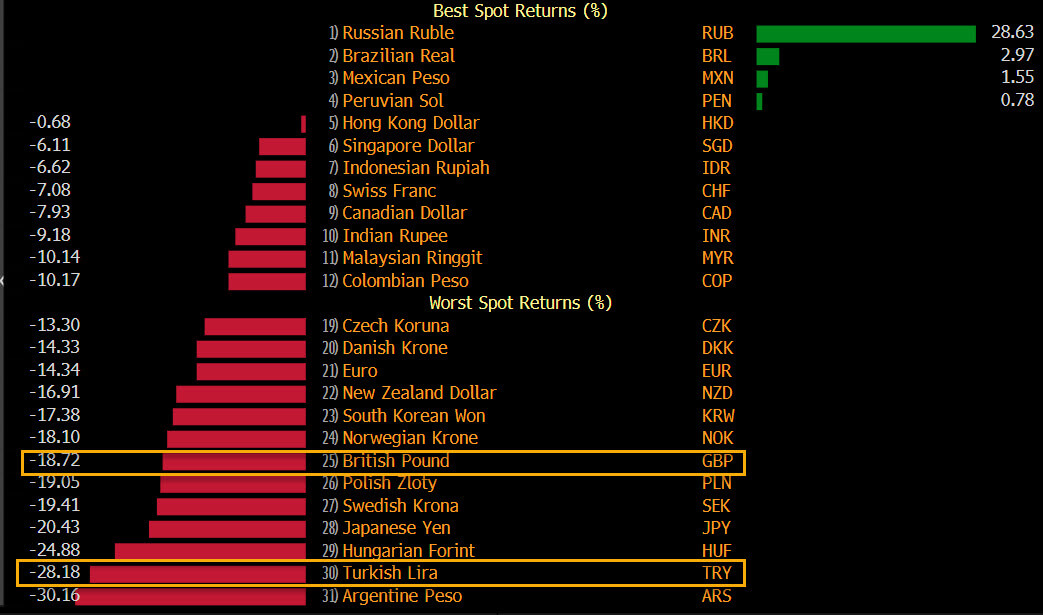
The DXY has been devastating in 2022; it is up almost 20%, leaving all major currencies in trouble. Canadian and Australian dollars are down 8% and 11%, respectively, the Euro down 18%, while the British Pound and the Japanese Yen are down over 20% each.
However, one currency has emerged victorious over the US dollar, the Russian Ruble, which is almost up a whopping 30% on the DXY.
DXY milkshake theory
As the DXY strengthens, this puts pressure on emerging market currencies with US dollar-denominated liabilities. While their currency weakens comparatively against the US dollar, it makes it harder to meet the obligations of their payments in USD.
This ultimately leads to these markets printing more of their currency, most likely leading to hyperinflation (every fiat currency that has ever existed has failed with an average life expectancy of 27 years) or adoption of a US dollar standard, which we can see in El Salvador is trying to move away from by adopting Bitcoin.
CEO Santiago Capital Brent Johnson explains the failure of fiat currencies with a theory called the dollar milkshake theory; the loss of fiat currencies will be due to an ever-increasing demand for US dollars, encompassed with a short supply of dollars, when the Fed stops making new dollars, demand for existing dollars goes up.
Equities & Volatility Gauge
The Standard and Poor’s 500, or simply the S&P 500, is a stock market index tracking the stock performance of 500 large companies listed on exchanges in the United States. S&P 500 3,586 -2.41% (5D)
The Nasdaq Stock Market is an American stock exchange based in New York City. It is ranked second on the list of stock exchanges by market capitalization of shares traded, behind the New York Stock Exchange. NASDAQ 10,971 -3.05% (5D)
The Cboe Volatility Index, or VIX, is a real-time market index representing the market’s expectations for volatility over the coming 30 days. Investors use the VIX to measure the level of risk, fear, or stress in the market when making investment decisions. VIX 32 -0.91% (5D)
The 2020s will be filled with volatility; fasten your seatbelts
On Sept. 27, The Move index (the “VIX of the bond market”) closed at 158.12. This is the second-highest print in 13 years. Since the GFC, the only higher score was the height of the pandemic on March 9, 2020.
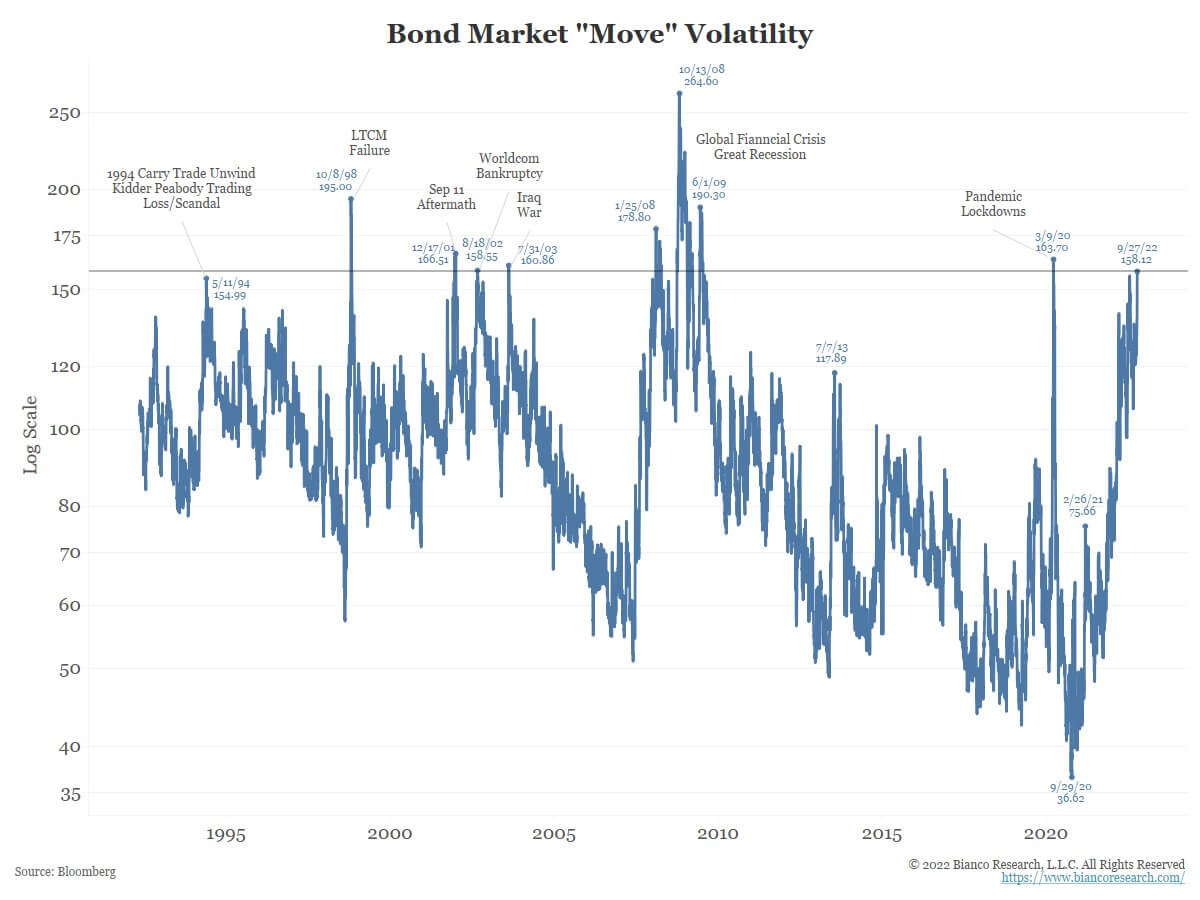
When the Move index exceeds 155, the Fed discusses the possibility of cutting interest rates to 0 or starting their quantitative easing program. However, this is not the case, the fed is in the midst of its quantitative tightening program, and the market is still pricing 4.25 – 4.5% interest rates for the end of 2022.
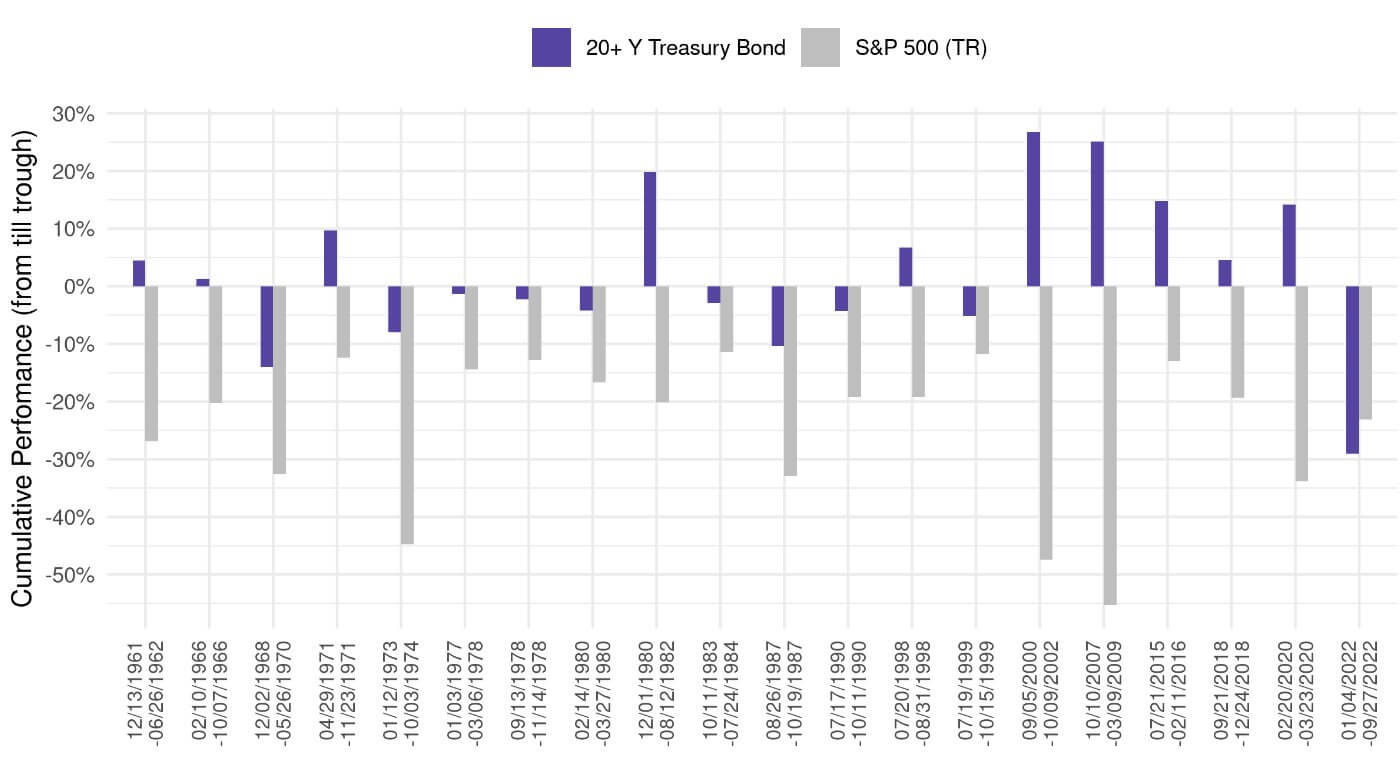
How bad is it out there?
Last week’s report discussed the the 60/40 portfolio, which had been at its worst performance since 1937. Below are the top 20 peak-to-trough drawdowns for the S&P 500 going back to 1961. Never, in history, when witnessing an extreme drawdown of stocks, have US treasuries (the risk off asset) plunged more than stocks. If alarm bells aren’t ringing, they should now.
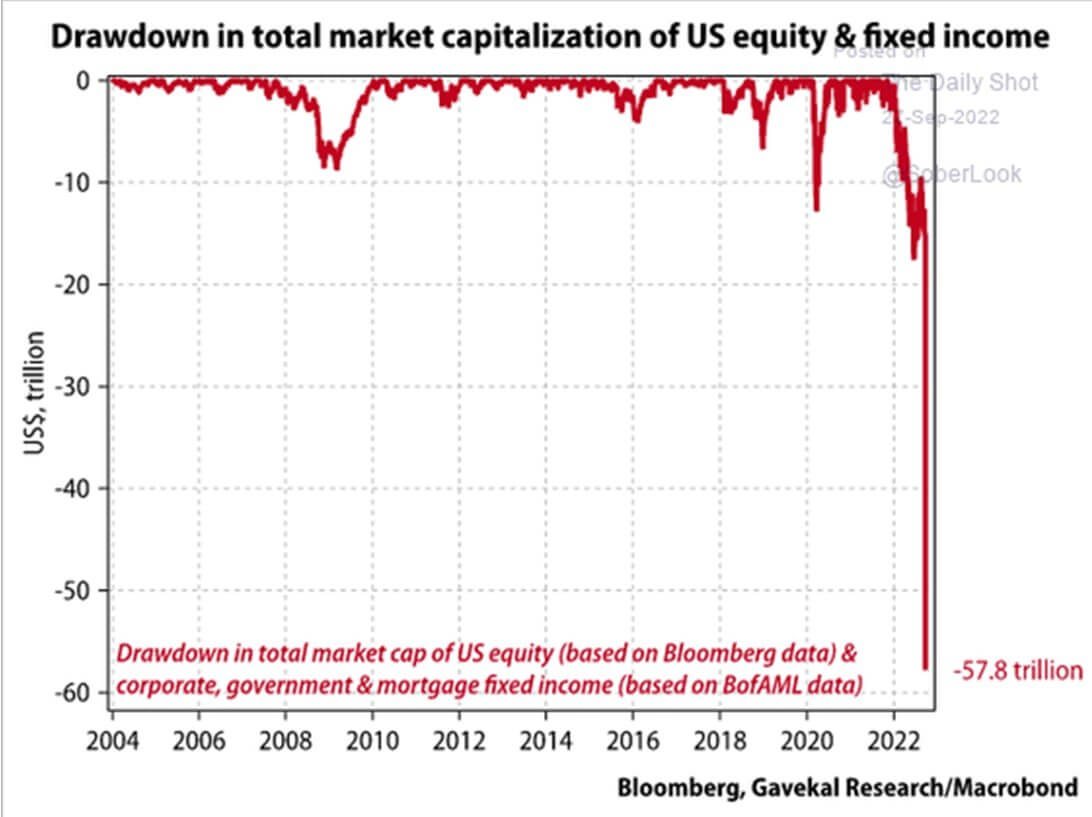
To reinforce the point above, almost $60 trillion has been wiped out in US stocks and the fixed income market.
Commodities
Rates & Currency
The 10-year Treasury note is a debt obligation issued by the United States government with a maturity of 10 years upon initial issuance. A 10-year Treasury note pays interest at a fixed rate once every six months and pays the face value to the holder at maturity. 10Y Treasury Yield 3.8% 3.85% (5D)
The U.S. dollar index is a measure of the value of the U.S. dollar relative to a basket of foreign currencies. DXY 112.17 -0.72% (5D)
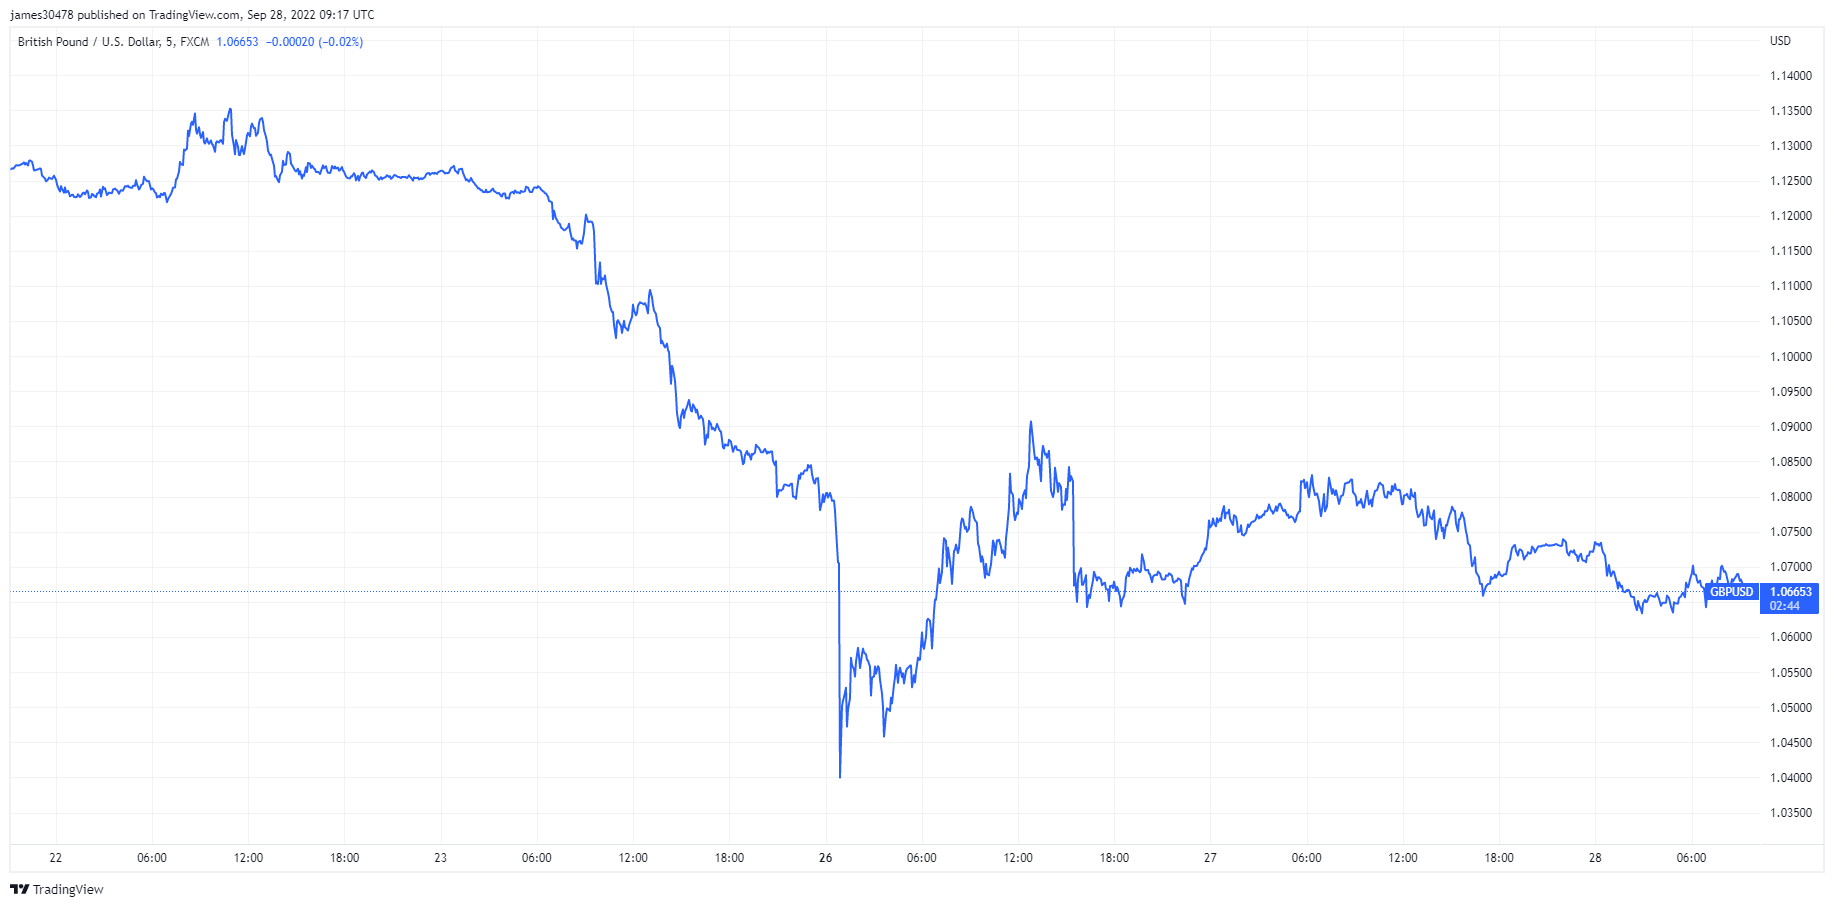
The United Kingdom is in turmoil
On Sept. 26, the British pound collapsed against the US dollar to 1.03, sinking to an all-time low. This was on the back of the chancellor unveiling a fresh fiscal stimulus that will increase the UK’s estimated deficit by £72 billion, adding fuel to the inflation fire. The poor performance of the sterling was also coupled with a mere 50 bps hike by the BOE. Since then, the sterling has continued its collapse along with gilts and FTSE 100.
As the days continued, rumblings were heard of emergency rate hikes from the BOE to contain sky-high inflation. However, on Sept 28, the BOE carried out the temporary purchases of long-dated UK bonds doing the inverse of controlling inflation. This was a pivot from the BOE; for yields to be contained, quantitative easing had to continue, which would only devalue the pound further. The BOE is trapped, and all other major central banks may likely follow suit.
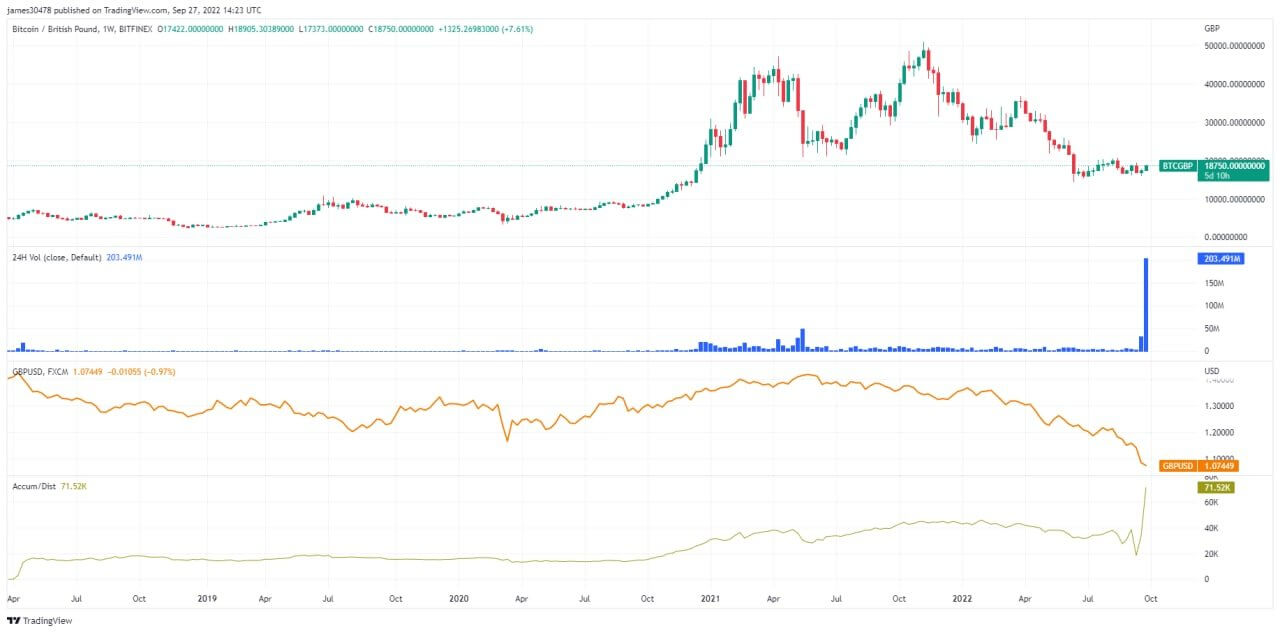
Did UK investors hedge sterling collapse with Bitcoin?
With the pound plummeting to its 30-year low, people flocked to hard assets to avoid major losses. On Sept. 26, the BTC/GBP trading volume soared over 1,200% as British pound holders began aggressively purchasing Bitcoin. This stands in sharp contrast to the BTC/USD pair, which has seen a relatively flat trading volume on centralized exchanges throughout the summer.
British chancellor Kwasi Kwarteng’s newly imposed tax cuts and borrowing plans further debased the pound and led to a sharp decrease in U.K. government bonds. To protect their holdings from risks associated with inflation and rising interest rates, most pension funds invest heavily in long-term government bonds. The Bank of England’s emergency measures are an attempt to provide support to thousands of cash-strapped pension funds that are in danger of failing to meet margin calls.
Bitcoin Overview
The price of Bitcoin (BTC) in USD. Bitcoin Price $19,170 -2.37% (5D)
The measure of Bitcoin’s total market cap against the larger cryptocurrency market cap. Bitcoin Dominance 41% -0.26% (5D)
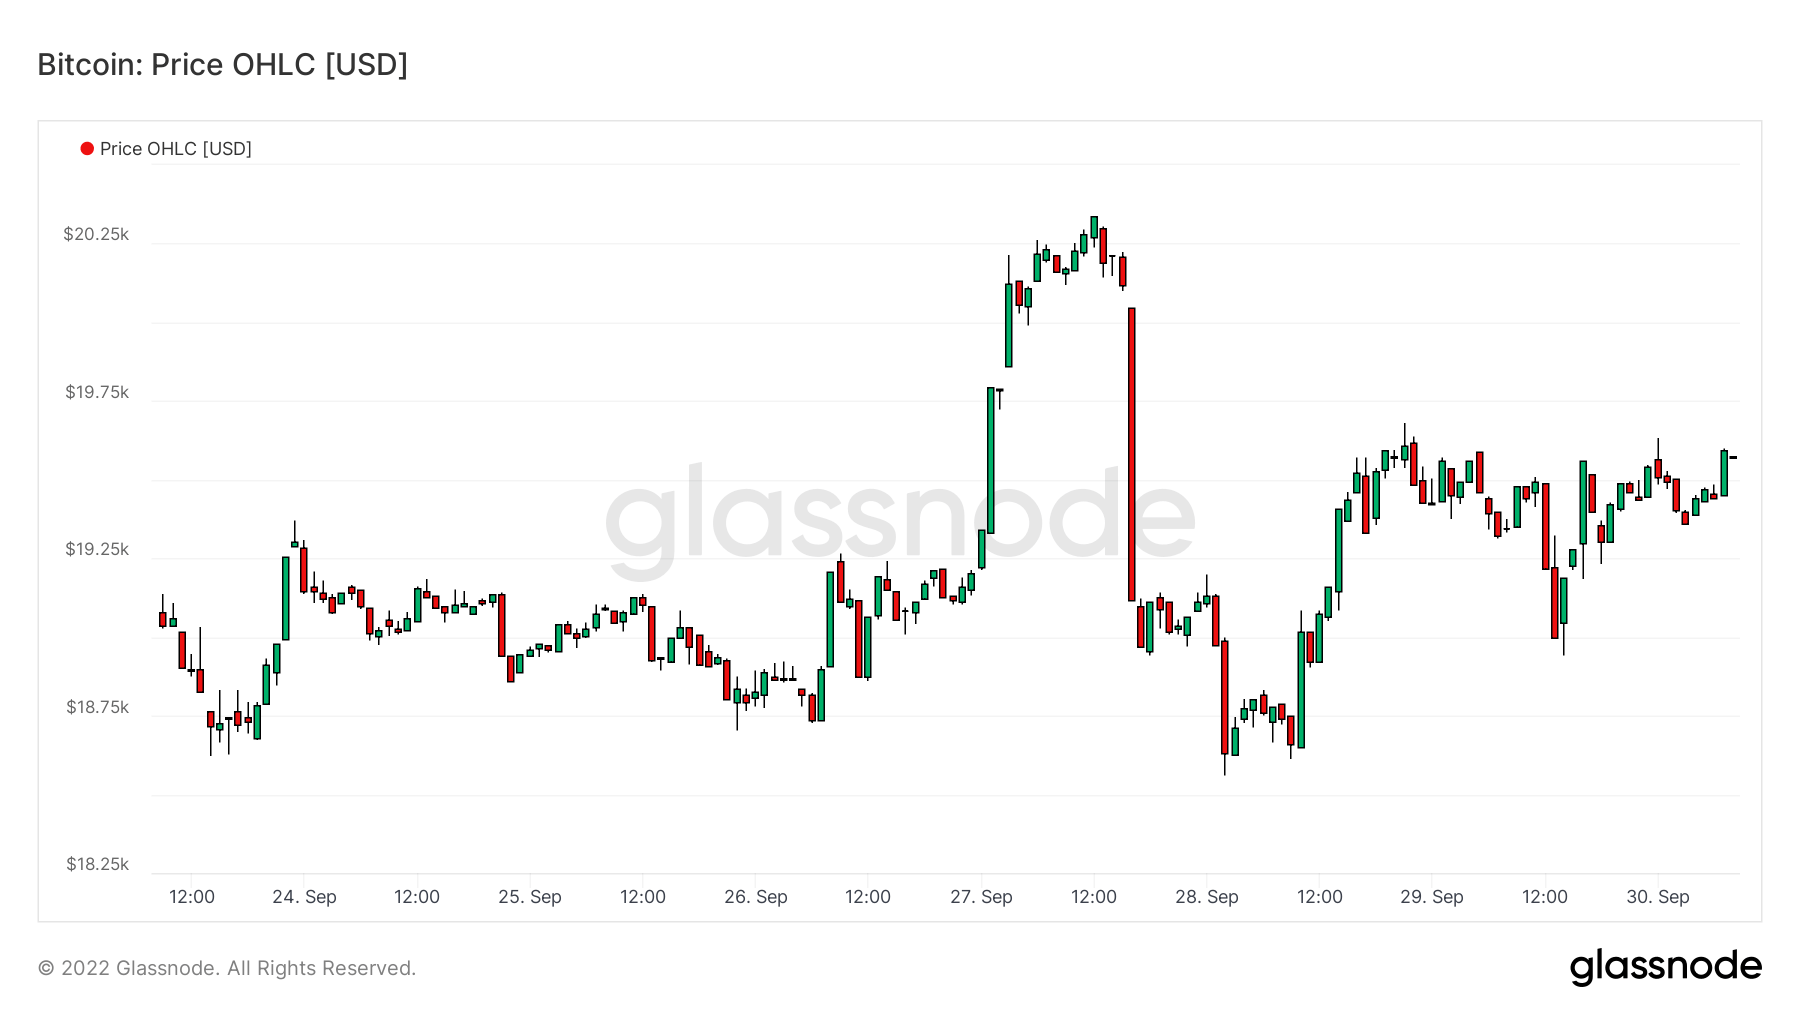
- Bitcoin has shown excellent strength, trading just below $20k for the week commencing Sept. 26
- Bitcoin is currently holding onto July lows, and if it were to break down lower, a large gap occurs down to $12k
- Options market is suggesting a positive outlook for the end of Q4
- Small amounts of accumulation are occurring from long-term holders who are currently holding the floor
- Lightning network capacity closes in on 5,000 BTC
Entities
Entity-adjusted metrics use proprietary clustering algorithms to provide a more precise estimate of the actual number of users in the network and measure their activity.
The number of unique entities that were active either as a sender or receiver. Entities are defined as a cluster of addresses that are controlled by the same network entity and are estimated through advanced heuristics and Glassnode’s proprietary clustering algorithms. Active Entities 277,748 1.59% (5D)
The number of BTC in the Purpose Bitcoin ETF. Purpose ETF Holdings 23,596 -0.07% (5D)
The number of unique entities holding at least 1k BTC. Number of Whales 1,693 -0.29% (5D)
The total amount of BTC held on OTC desk addresses. OTC Desk Holdings 3,020 BTC 25.68% (5D)
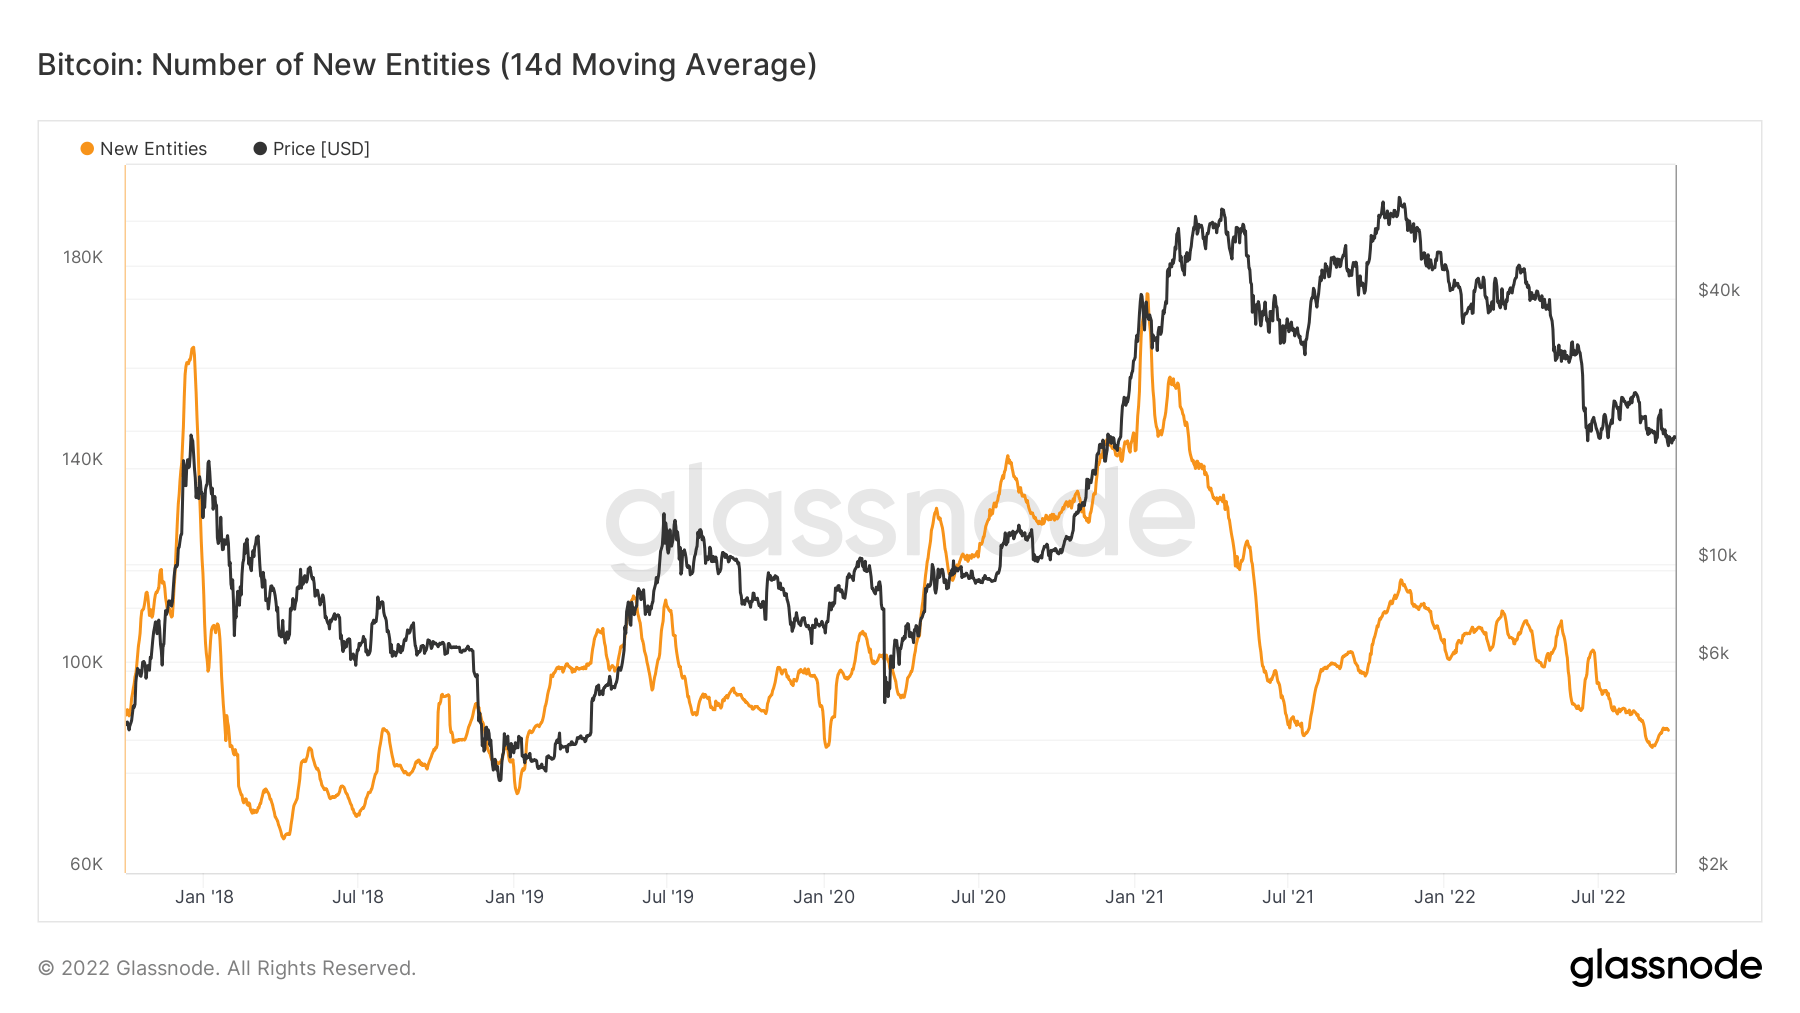
New entities sink to multi-year lows
The number of unique entities that appeared for the first time in a transaction of the native coin in the network. Entities are defined as a cluster of addresses that are controlled by the same network entity.
New entities have sunk to multi-year lows and re-tested a low seen during 2020, which tells us there isn’t a new influx of participants coming into the ecosystem. However, we were still higher than the previous bear market cycle in 2018. From the data, new tourists are coming in and staying; the network continues to put in a higher high each cycle.
Dervatives
A derivative is a contract between two parties which derives its value/price from an underlying asset. The most common types of derivatives are futures, options and swaps. It is a financial instrument which derives its value/price from the underlying assets.
The total amount of funds (USD Value) allocated in open futures contracts. Futures Open Interest $11.37B 3.91% (5D)
The total volume (USD Value) traded in futures contracts in the last 24 hours. Futures Volume $46.51B $39.72 (5D)
The sum liquidated volume (USD Value) from short positions in futures contracts. Total Long Liquidations $72.47M $0 (5D)
The sum liquidated volume (USD Value) from long positions in futures contracts. Total Short Liquidations $44.06M $0 (5D)
Volatility will continue as future open interest soars
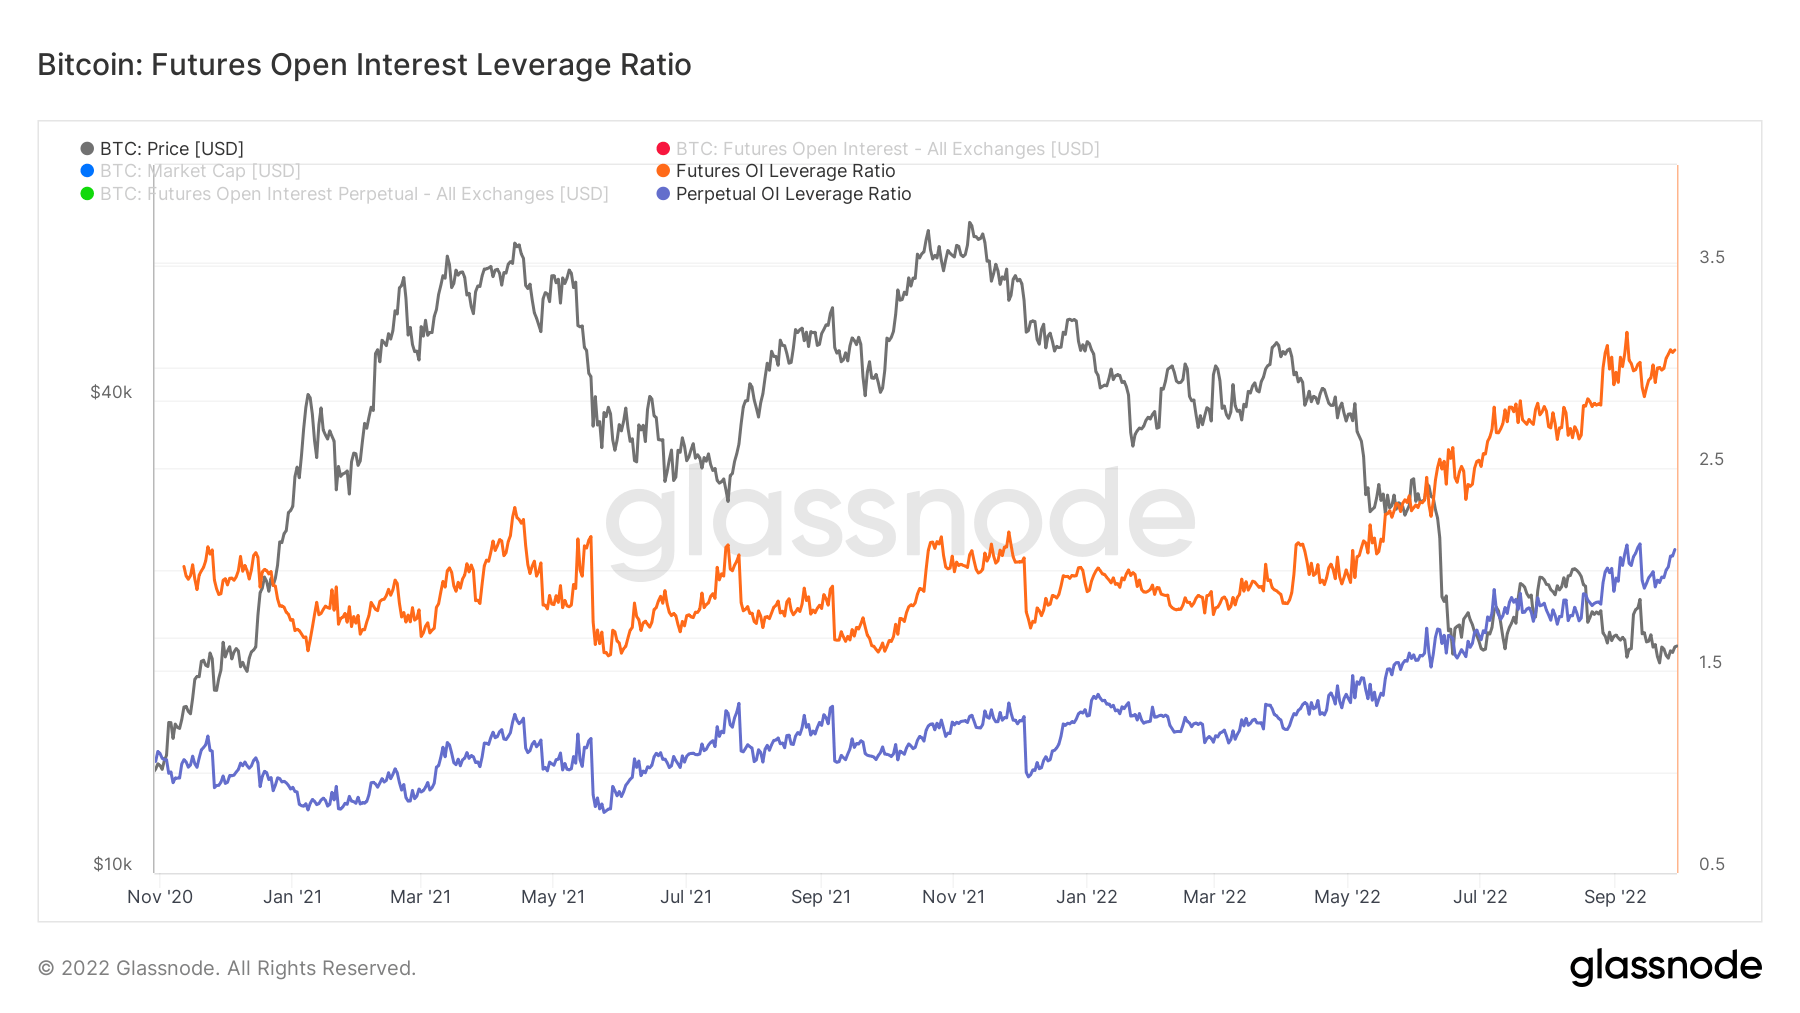
The Futures Open Interest Leverage Ratio is calculated by dividing the market open contract value by the market cap of the asset (presented as %). This returns an estimate of the degree of leverage relative to market size to gauge whether derivatives markets are a source of deleveraging risk.
- High Values indicate that futures market open interest is large relative to the market size. This increases the risk of a short/long squeeze, deleveraging event, or liquidation cascade.
- Low Values indicate that futures market open interest is small relative to the market size. This is generally coincident with a lower risk of derivative-led forced buying/selling and volatility.
- Deleveraging Events such as short/long squeezes or liquidation cascades can be identified by rapid declines in OI relative to market cap and vertical drops in the metric.
Futures’ open interest leverage ratio is approaching all-time highs; this increases the chance of further deleveraging and liquidations events. During the Luna collapse and multiple insolvencies that took place from April – July 2022, a lot of leverage has been wiped out, but it still seems a lot of risk appetite exists.
Traditional finance is starting to see much of its leverage unwind; it will be crucial for Bitcoin to hold this price range as the value continues to be wiped out in stocks and fixed-income.
What’s the outlook for Q4?
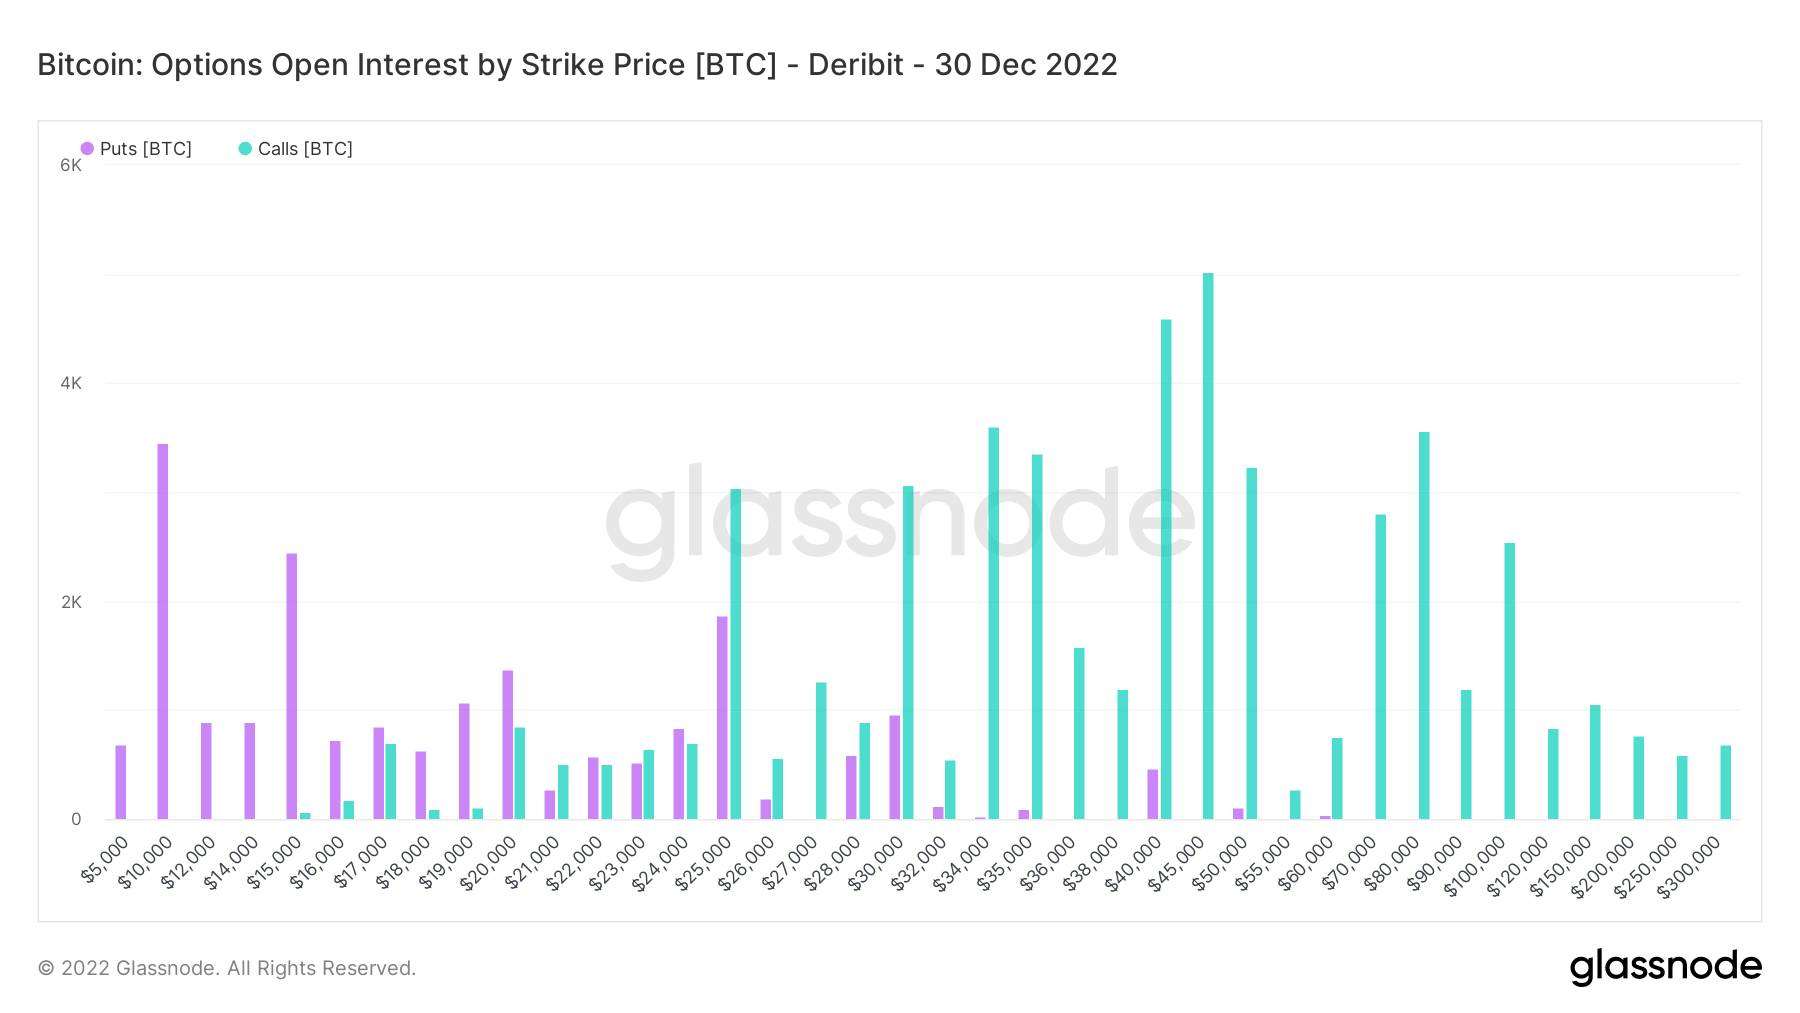
The total open interest of call and put options by strike price for a specific options contract. A call option gives the holder the right to buy a stock, and a put option gives the holder the right to sell a stock.
Zooming into December 30, thousands of calls for over $35,000 a Bitcoin are encouraging. September has been a bloodbath for traditional finance yet Bitcoin is only down 2.5% and has held $18,000 firmly. However, with earnings season on the horizon and bitter winter for Europe, it may be hard to see these numbers end the year.
Miners
Overview of essential miner metrics related to hashing power, revenue, and block production.
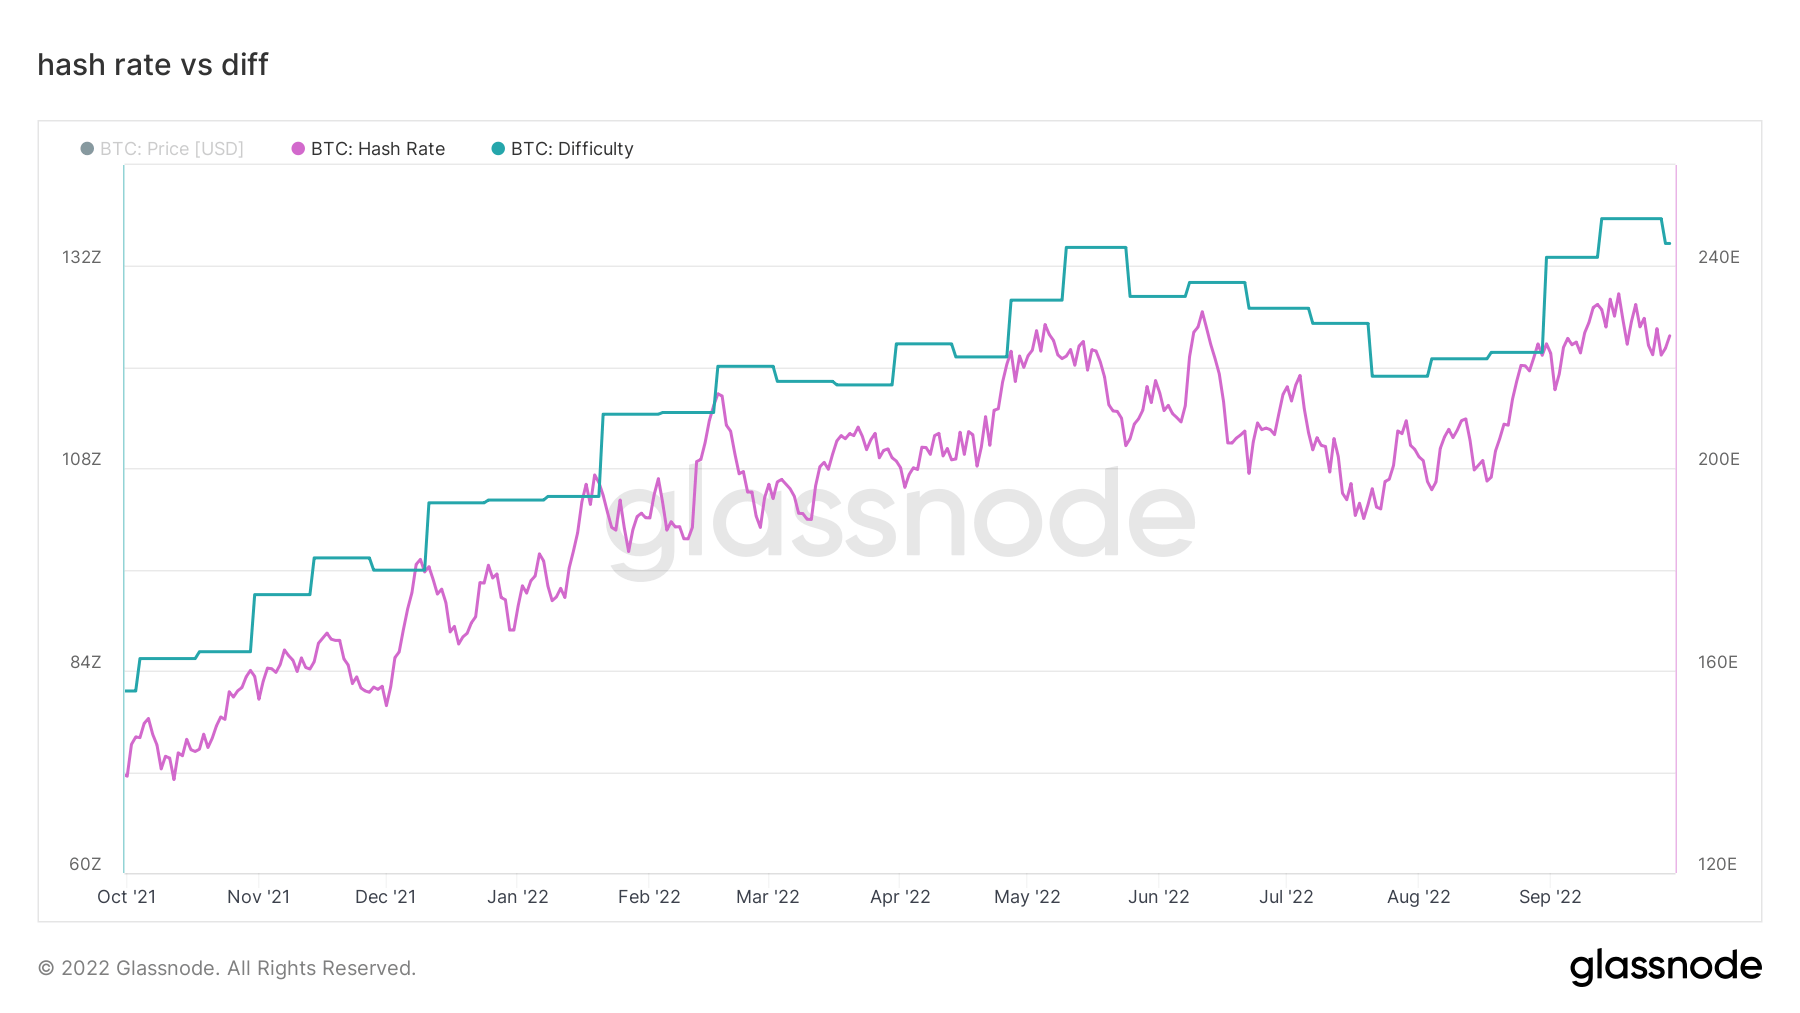
The average estimated number of hashes per second produced by the miners in the network. Hash Rate 221 TH/s -3.91% (5D)
The current estimated number of hashes required to mine a block. Note: Bitcoin difficulty is often denoted as the relative difficulty with respect to the genesis block, which required approximately 2^32 hashes. For better comparison across blockchains, our values are denoted in raw hashes. Difficulty 134 T -2.19% (14D)
The total supply held in miner addresses. Miner Balance 1,834,729 BTC -0.01% (5D)
The total amount of coins transferred from miners to exchange wallets. Only direct transfers are counted. Miner Net Position Change -23,635 BTC -5,946 BTC (5D)
Miners are feeling the pressure.
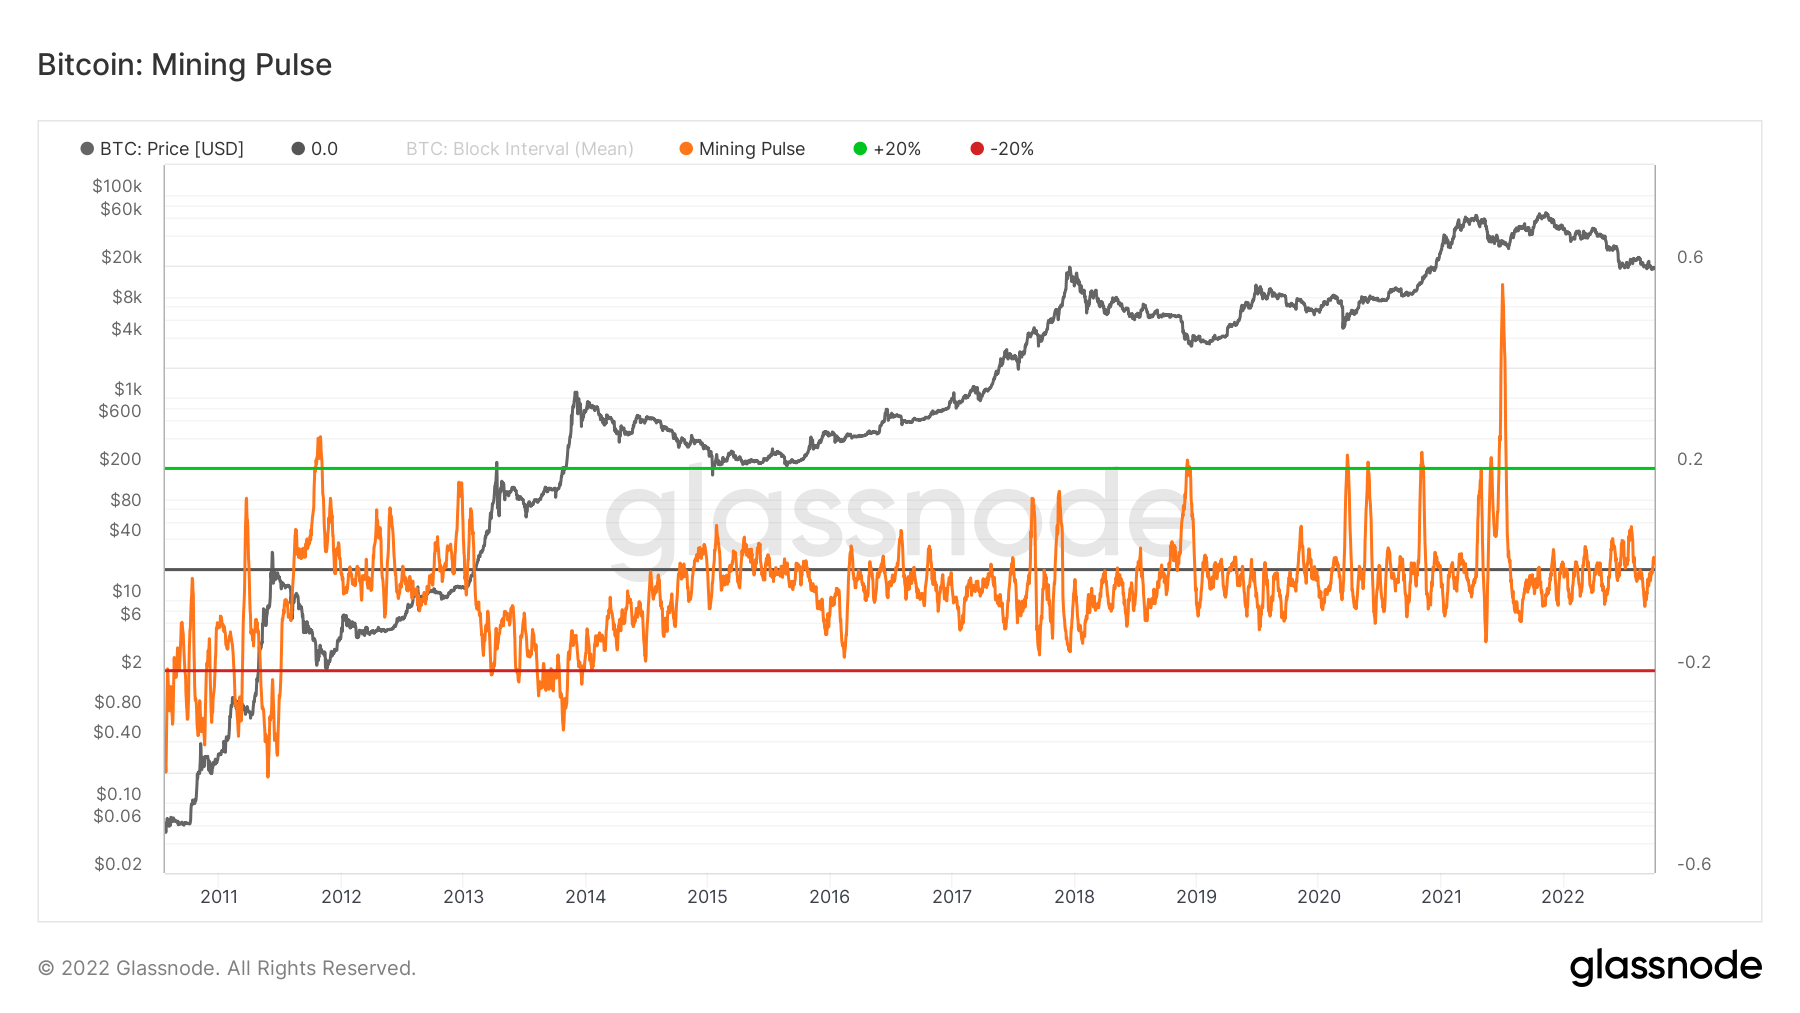
The Mining Pulse shows the deviation between the 14-day average Block Interval and the target time of 10 minutes. Values of the oscillator can be considered as how many seconds faster (negative) or slower (positive) are blocks being mined relative to the target block-time of 600s.
- Negative values indicate the observed block time is faster than the target block time. This usually occurs when hash-rate growth outpaces upward difficulty adjustments and suggests an expansion of network hashpower is underway.
- Positive values indicate the observed block time is slower than the target block time. This usually occurs when the hash rate is slowing down more than downwards difficulty adjustments, meaning miners are coming offline.
Currently, the mining pulse is marginally in positive territory, which indicates the Bitcoin network is in a slower block time as the hash rate hit an all-time high recently. Mining difficulty was also at an all-time high. However, we are now seeing declines in both. The Hash rate has started to come down while difficulty has its first downwards adjustment since July.
As difficulty stays near all-time highs, this will continue to pressure miners; expect to see difficulty continue to drop while unprofitable miners continue to get purged from the network. For the second half of 2022, we have been above the mining pulse, which has also coupled with miner capitulation, miners are not out of the woods at the moment, but it looks much healthier than it did in previous weeks and months.
On-Chain Activity
Collection of on–chain metrics related to centralized exchange activity.
The total amount of coins held on exchange addresses. Exchange Balance 2,413,528 BTC 22,005 BTC (5D)
The 30 day change of the supply held in exchange wallets. Exchange Net Position Change 281,432 BTC 172,348 BTC (30D)
The total amount of coins transferred from exchange addresses. Exchange Outflows Volume 185,654 BTC -12 BTC (5D)
The total amount of coins transferred to exchange addresses. Exchange Inflows Volume 173,456 BTC -12 BTC (5D)
Diamond hands for mature holders
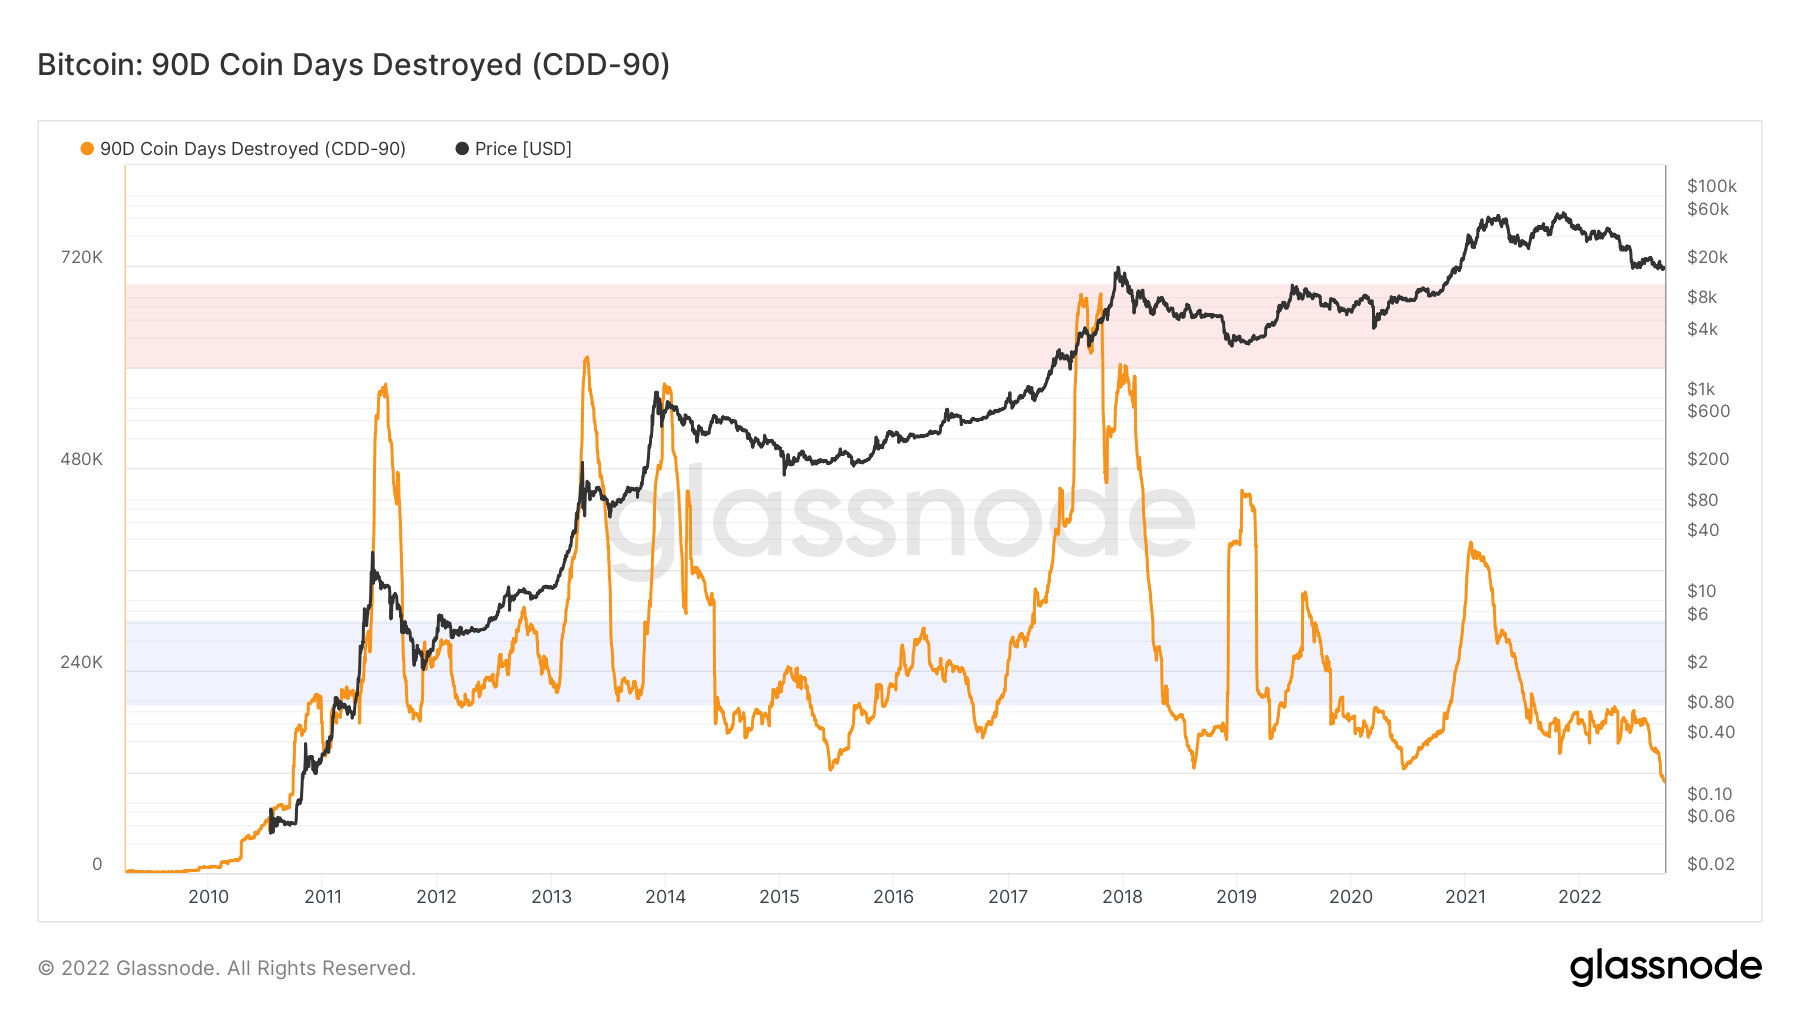
Coin Days Destroyed (CDD) for any given transaction is calculated by taking the number of coins in a transaction and multiplying it by the number of days since those coins were last spent.
90D Coin Days Destroyed is the 90-day rolling sum of Coin Days Destroyed (CDD) and shows the number of coin days destroyed over the past year. This version is age-adjusted, meaning that we normalize by time to account for the increasing baseline as time goes by.
Coin days destroyed visualize the periods when old and younger coins have been spent. The metric is at an all-time low, demonstrating that mature coins are holding on to their Bitcoin and thus being the dominant behavior for this type of investor. During the bull runs of 2013, 2017, and 2021, CDD significantly increased as this type of cohort sold for profits. We are amid bear market accumulation.
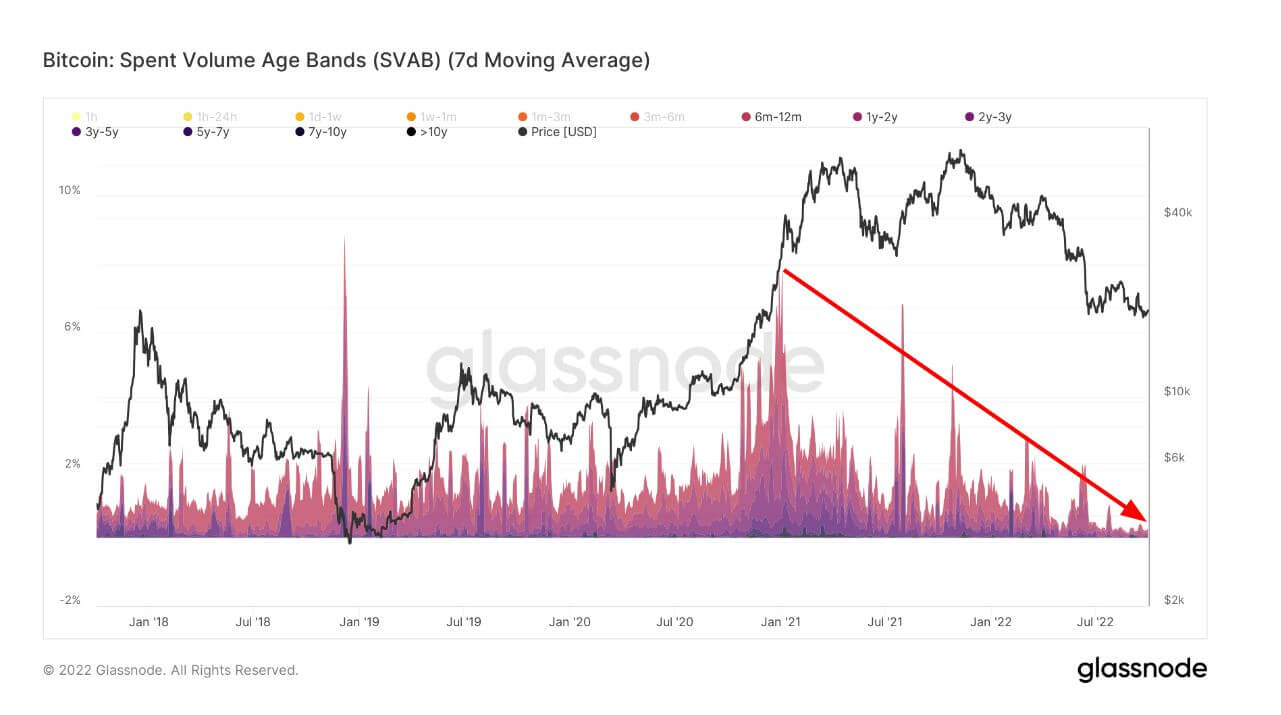
The metric spent volume age bands support diamond hands from LTHs, separating the on-chain transfer volume based on the coins’ age. Each band represents the percentage of the spent volume previously moved within the period denoted in the legend.
LTHs (6+ months) are spending coins at an aggressive rate during the peak of the 2021 bull run at the beginning of January at a high of almost 8% of the cohort. However, as time goes on and the price of Bitcoin has continuously dropped into 2022, mature hands are reluctant to sell BTC at this price range as this HODLing behavior has been one of the strongest for many years.
Layer-2
Secondary layers, such as the Lightning Network, exist on the Bitcoin blockchain and allows users to create payment channels where transactions can occur away from the main blockchain
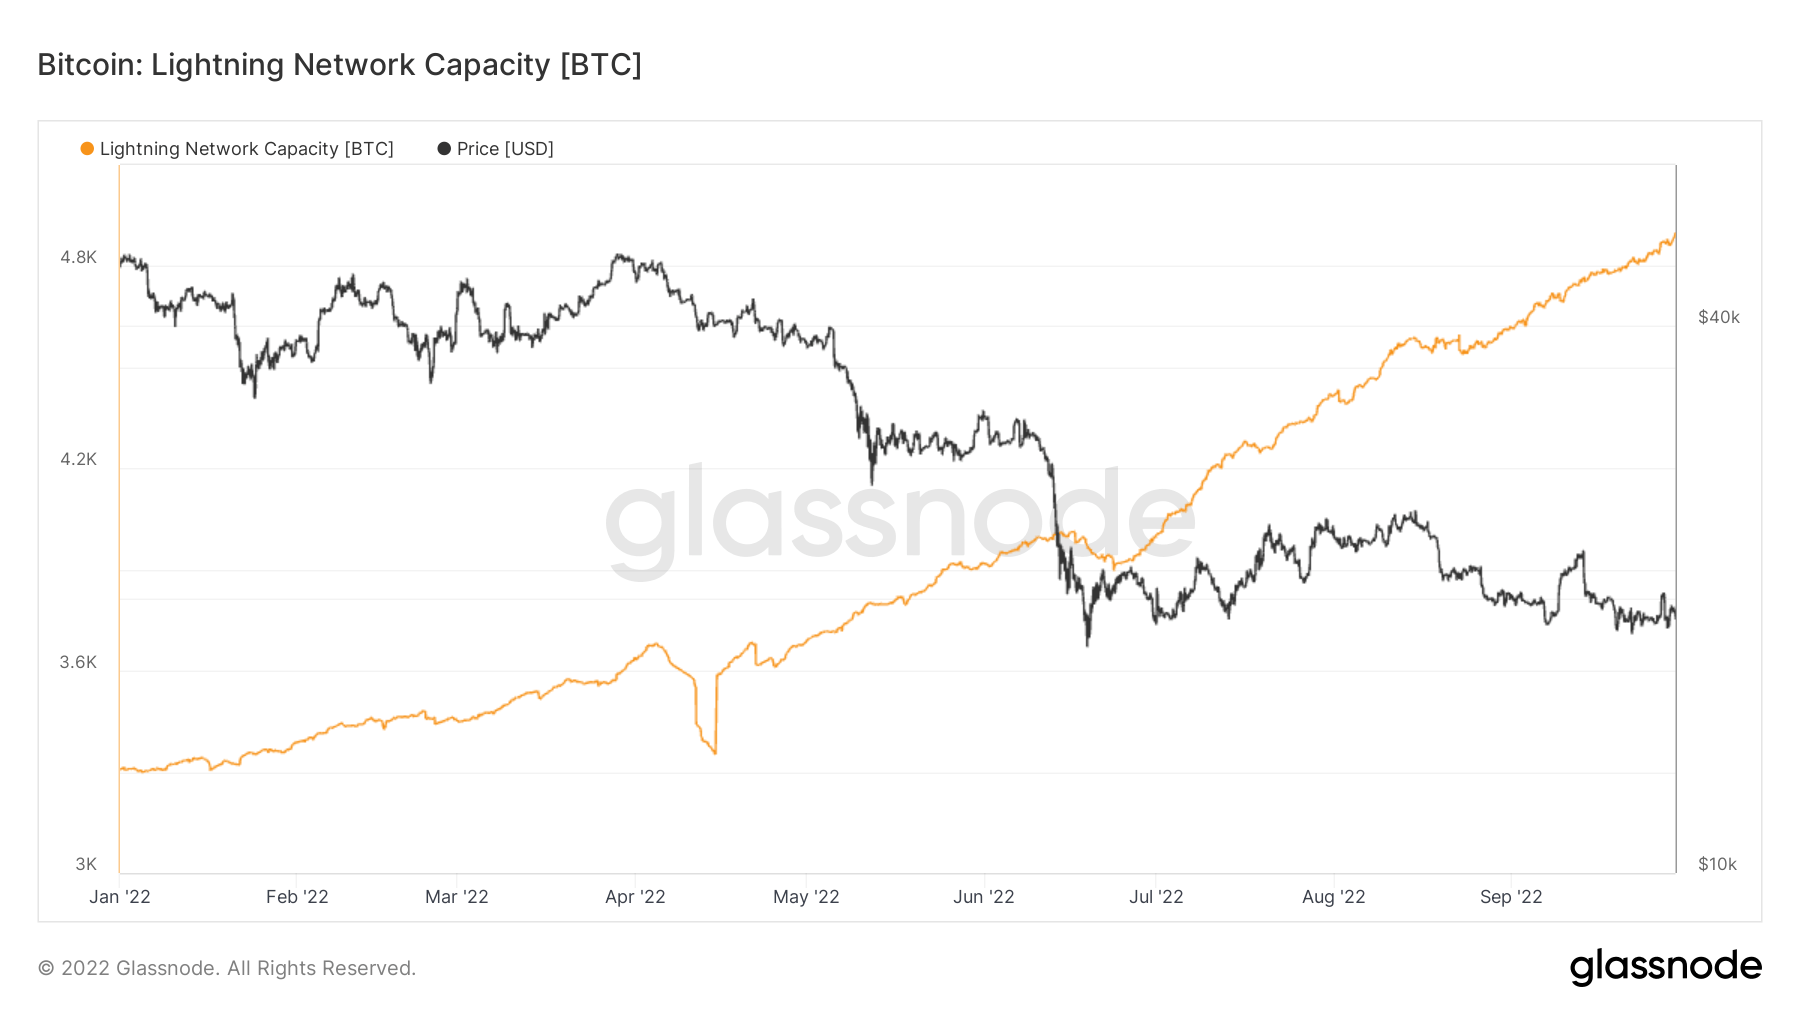
The total amount of BTC locked in the Lightning Network. Lightning Capacity 4,903 BTC 3.24% (5D)
The number of Lightning Network nodes. No. of Nodes 17,439 -0.11% (5D)
The number of public Lightning Network channels. No. of Channels 83,555 -2.79% (5D)
Lightning network capacity closes in on 5,000 BTC
One of the better news stories this cycle is that the lightning network capacity keeps growing, hitting all-time highs each week, which is all pure organic growth. We should expect to cross the 5,000 BTC mark next week.
Supply
The total amount of circulating supply held by different cohorts.
The total amount of circulating supply held by long term holders. Long Term Holder Supply 13.69M BTC 0.33% (5D)
The total amount of circulating supply held by short term holders. Short Term Holder Supply 3.01M BTC -1.97% (5D)
The percent of circulating supply that has not moved in at least 1 year. Supply Last Active 1+ Year Ago 66% 0.15% (5D)
The total supply held by illiquid entities. The liquidity of an entity is defined as the ratio of cumulative outflows and cumulative inflows over the entity’s lifespan. An entity is considered to be illiquid / liquid / highly liquid if its liquidity L is ≲ 0.25 / 0.25 ≲ L ≲ 0.75 / 0.75 ≲ L, respectively. Illiquid Supply 14.78M BTC -0.17% (5D)
Long vs. short-term holder supply
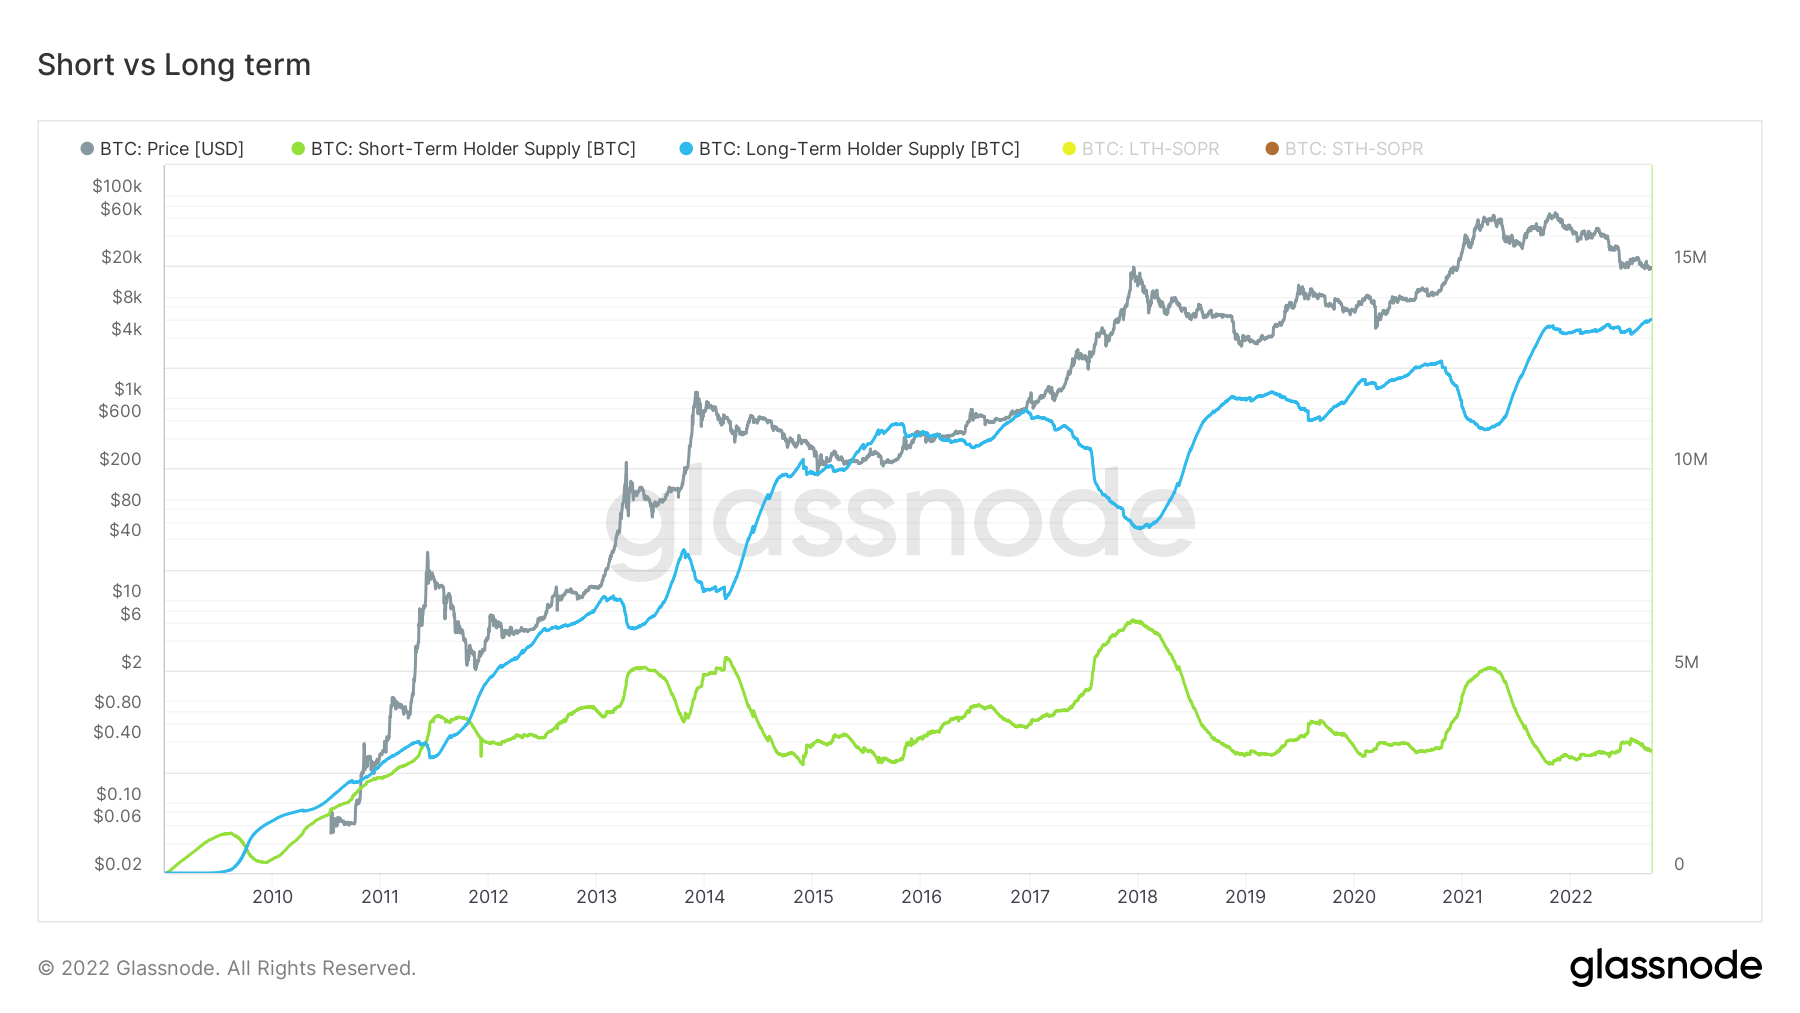
Long-term holders are defined as holders of Bitcoin for more than 155 days and are considered the smart money of the ecosystem and sell during bull runs but accumulate and hold during bear markets. This is a consistent approach from this cohort, while the inverse occurs with short-term holders as they are more prone to dollar value.
Throughout BTC history, when peak bull runs occur, LTHs sell, but when bear markets come to the fold, they accumulate. This is happening now, which is encouraging, holding over 13.6 million BTC, while STH’s starting to sell and decreasing their position size.
Cohorts
Breaks down relative behavior by various entities’ wallet.
SOPR – The Spent Output Profit Ratio (SOPR) is computed by dividing the realized value (in USD) divided by the value at creation (USD) of a spent output. Or simply: price sold / price paid. Long-term Holder SOPR 0.53 -7.02% (5D)
Short Term Holder SOPR (STH-SOPR) is SOPR that takes into account only spent outputs younger than 155 days and serves as an indicator to assess the behaviour of short term investors. Short-term Holder SOPR 0.99 1.02% (5D)
The Accumulation Trend Score is an indicator that reflects the relative size of entities that are actively accumulating coins on-chain in terms of their BTC holdings. The scale of the Accumulation Trend Score represents both the size of the entities balance (their participation score), and the amount of new coins they have acquired/sold over the last month (their balance change score). An Accumulation Trend Score of closer to 1 indicates that on aggregate, larger entities (or a big part of the network) are accumulating, and a value closer to 0 indicates they are distributing or not accumulating. This provides insight into the balance size of market participants, and their accumulation behavior over the last month. Accumulation Trend Score 0.420 -2.33% (5D)
Look down below – $12k BTC is possible
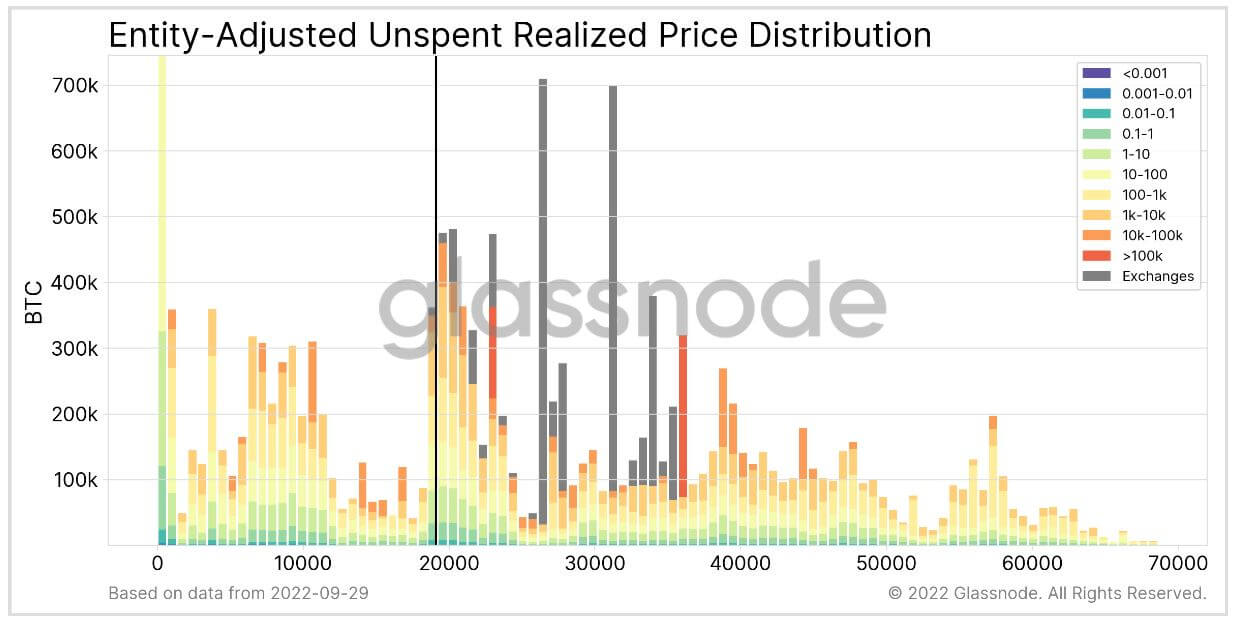
The URPD metric is a tool that shows at which prices the current set of Bitcoin UTXOs were created, i.e., each bar shows the number of existing bitcoins that last moved within that specified price bucket. The following metrics are a series of variants that further break down the data, looking at specific market cohorts.
In this version, the supply is segmented according to the total balance of the owning entity. This makes it possible to distinguish “whales” from “fish.” Exchanges are treated separately (grey). All supply is shown in the price bucket at which the respective entity has (on average) acquired its coins.
The black vertical bar shows the market price at the chart production timestamp.
An ample supply gap occurs below the June low of $17.6k down to the range of $10-$12k. A lot of the supply that has been bought around the $20k are investors with less than 1 Bitcoin; this could spell trouble if Bitcoin were to go lower, and this cohort would experience a further unrealized loss which could trigger a further downside.
Stablecoins
A type of cryptocurrency that is backed by reserve assets and therefore can offer price stability.
The total amount of coins held on exchange addresses. Stablecoin Exchange Balance $39.95B -0.16% (5D)
The total amount of USDC held on exchange addresses. USDC Exchange Balance $2.15B -1.11% (5D)
The total amount of USDT held on exchange addresses. USDT Exchange Balance $17.5B -0.16% (5D)
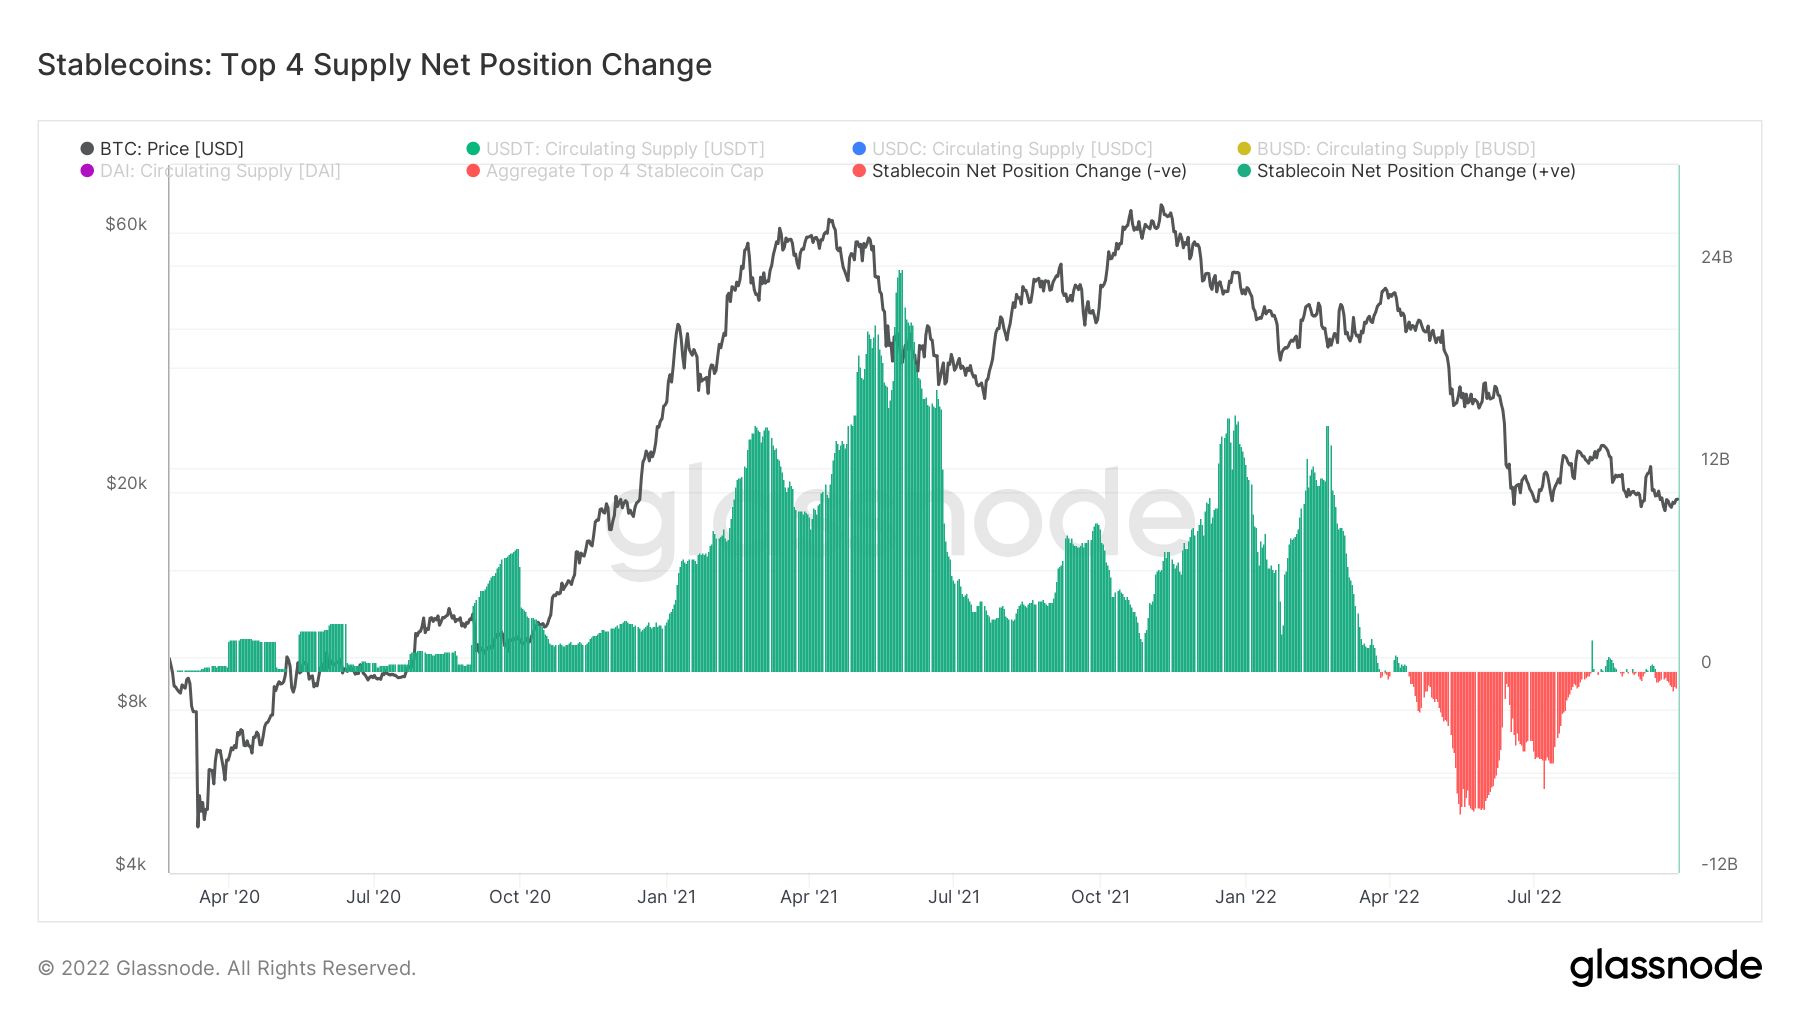
Stablecoin activity is muted, which is a positive sign
This chart shows the 30-day net change in the supply of the top four stablecoins USDT, USDC, BUSD, and DAI. Note that the supplies of these stablecoins are distributed between multiple host blockchains, including Ethereum.
2021 was a momentous year for stablecoins in particular, which saw a massive amount of stablecoins flowing onto exchanges as defi took off. Identifying the top 4 stablecoins, USDT, USDC, DAI, and BUSD, up to $24 billion were flowing at the peak in the middle of 2021.
However, 2022 has been a different story: many withdrawals and uncertainty. This has been coupled with macro uncertainty and the collapse of Luna. Since August, withdrawals have declined dramatically. It is very much muted activity which is positive to see in this market environment.
Credit: Source link


")


")


 Bitcoin
  Ethereum
  Tether
  BNB
BNB  Solana
  USDC
USDC  XRP
XRP  Toncoin
  Dogecoin
  Cardano
  Shiba Inu
  Avalanche
  Wrapped Bitcoin
  Bitcoin Cash
  Polkadot
  Polygon
  Litecoin
  NEAR Protocol
  Uniswap
  LEO Token
  Aptos
Aptos  First Digital USD
  Filecoin
  OKB
OKB  Stellar
  Cosmos Hub
  Render
  Bittensor
  Arbitrum
  Immutable
  Hedera
  dogwifhat
  Maker
Maker  Injective
  The Graph
  Ethena USDe
  Optimism
  Wrapped eETH
