
Macro Overview
Further pressure on BOJ and the Yen
In previous MacroSlate reports, Japan has been at the front and center of discussion and controversy regarding its fiscal and monetary policy.
On October 28, Japan’s CPI inflation rose to 3.5% (YOY) for October, a 31-year high, making life more difficult for the BOJ. The yen sank to a 32- year low against the U.S dollar ¥152 before another round of intervention from the BOJ.
The ten-year JGB yield remains firmly at .25%, but the long end of the yield curve remains unsupported and continues to climb to almost a ten-year high.
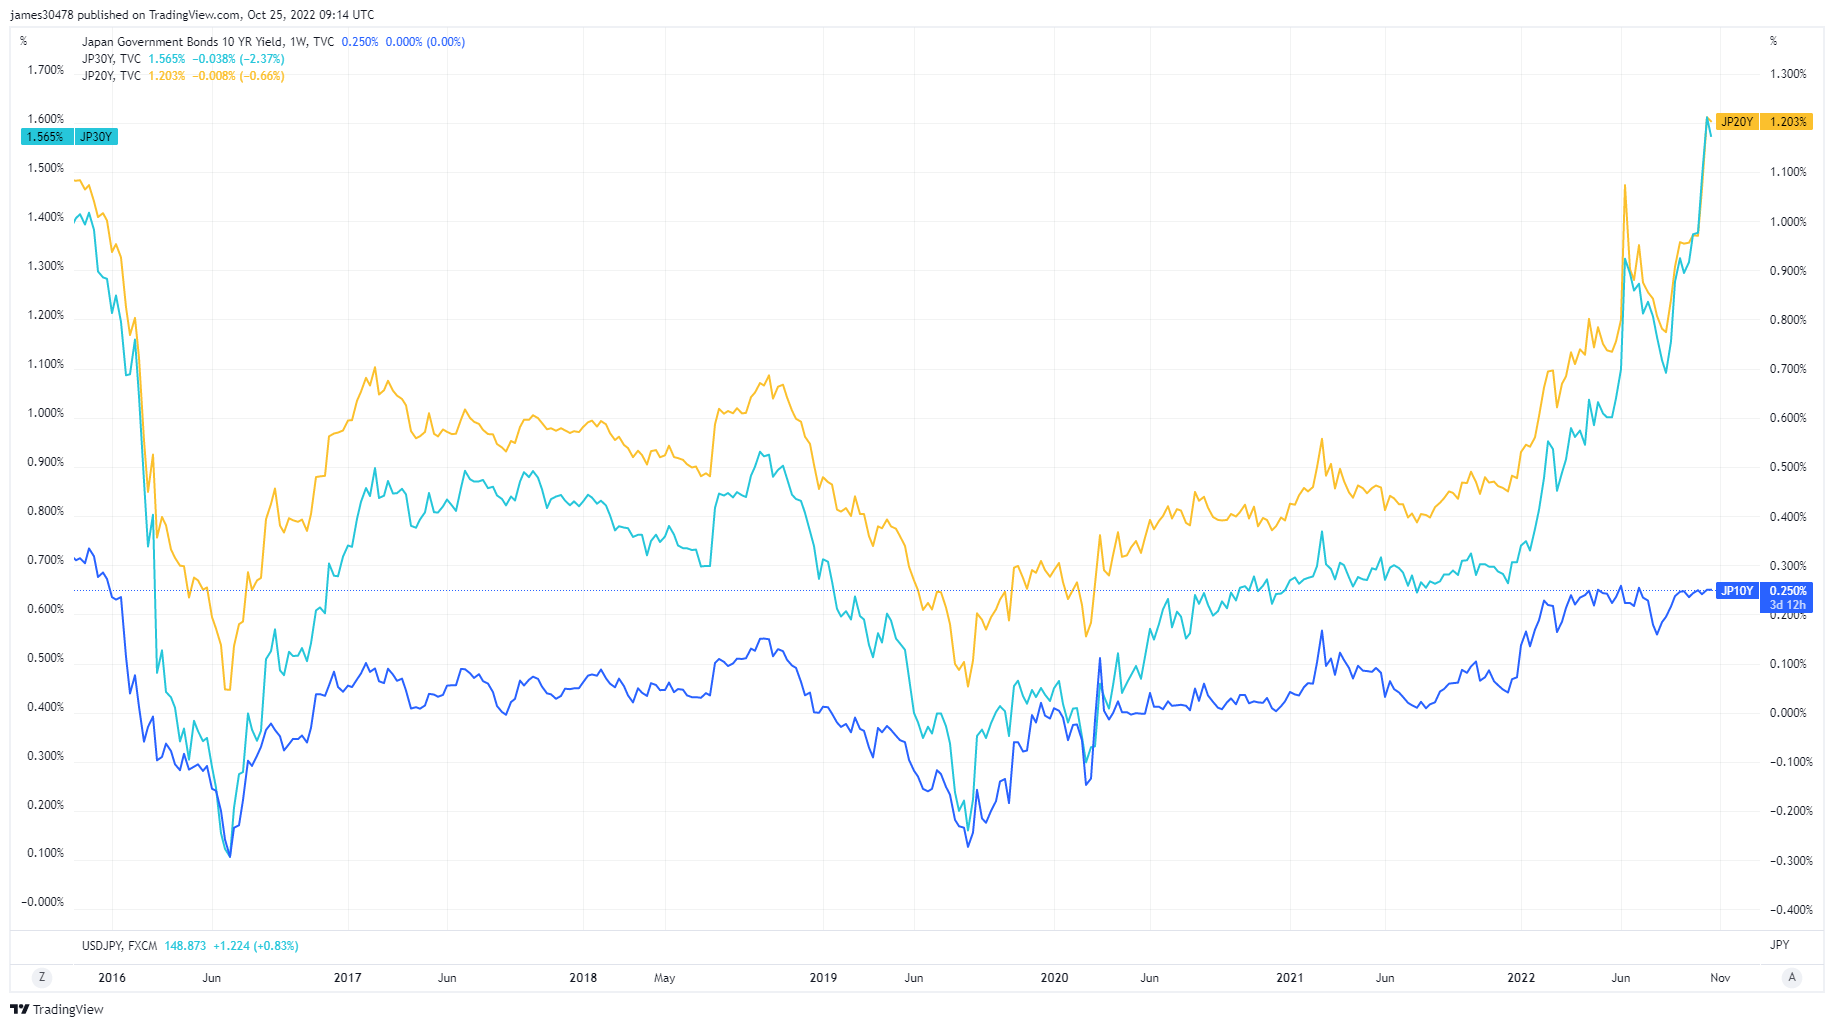
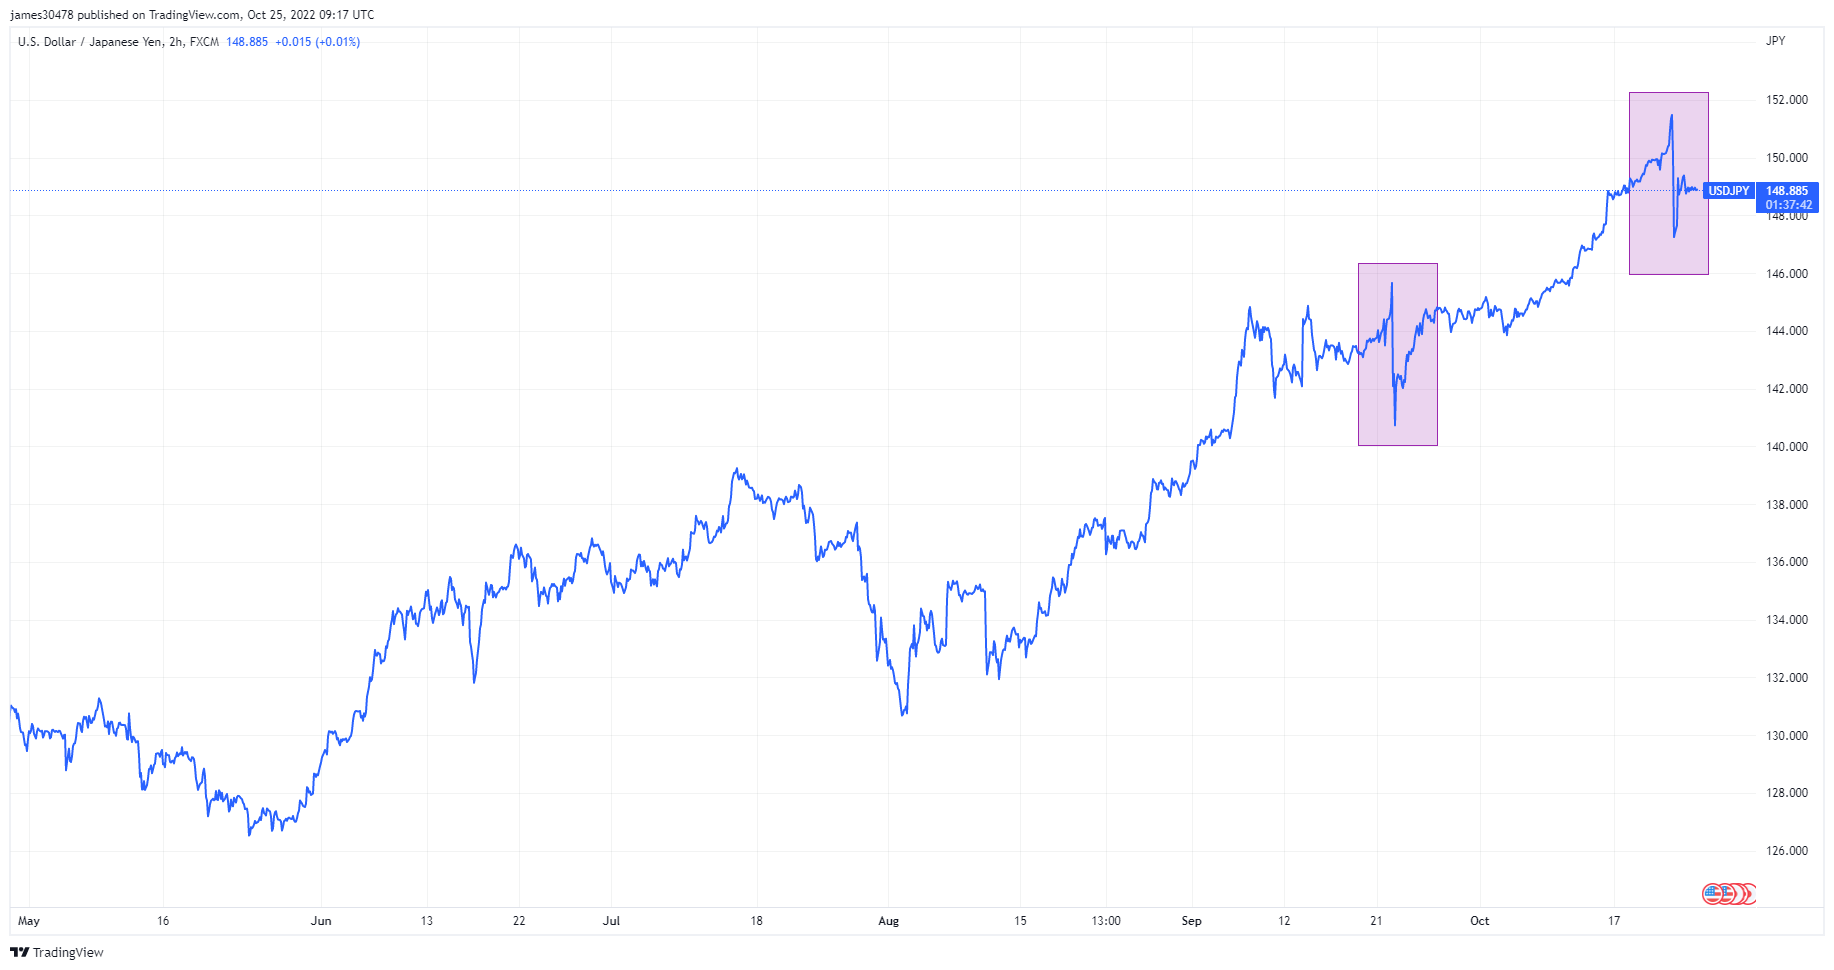
The U.S dollar is up 29% against the Japanese Yen so far in 2022. However, it has been more complex than you might think. The BOJ has thrown $50bn at the JPY to defend its peg, but it doesn’t seem to be doing much good. The above chart highlights where the BOJ has conducted their intervention; back in September, they used $20bn, and on Oct. 21, BOJ used $30bn. Japan currently has $1.2T in currency reserves. Will they continue to deploy resources and continue to witness the failed YCC experiment a failure?
To quantify this experiment, the BOJ has 24 more shots of $50 bn twice a month for one year, and then they’re out of ammo.
China is in a spot of bother
Chinese economic data got published the week commencing Oct. 24, while President Xi Jinping achieved a power grab extending his tenure for an unprecedented third term. The yuan continued its slide against the dollar, 7.3 and climbing. The worst daily decline for Hong Kong-listed Chinese stocks since 2008, coupled with a 7% collapse of the HSCEI index.
The Chinese real estate market continued its crisis as it still wrestled with covid lockdowns. Real estate collapsed a 29% drop in property sales for year-to-date compared to the same period as last year. However, China will not be able to achieve full-year GDP growth of 5.5%, as they stall at just under 4%.
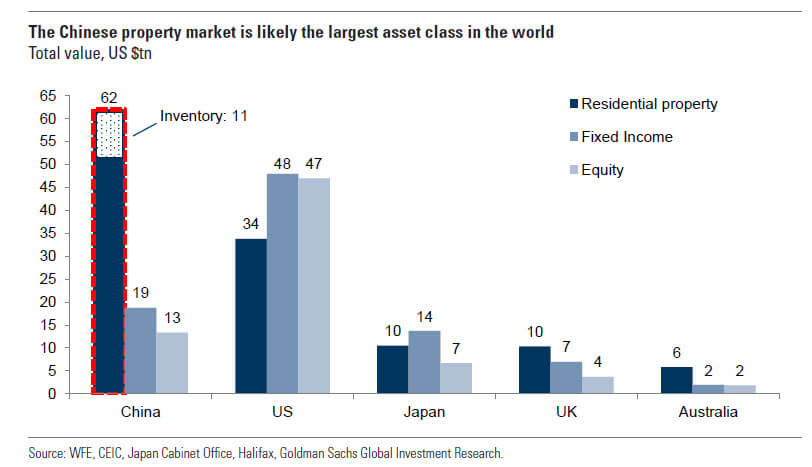
The Chinese property market is the largest asset class in the world, $62tn, which dwarfs all other asset classes, including the U.S. fixed-income and equity markets. When China’s real estate sneezes, the whole world will feel it.
Correlations
Bitcoin, Gold correlation nears one over the past year, indicating a possible bottom
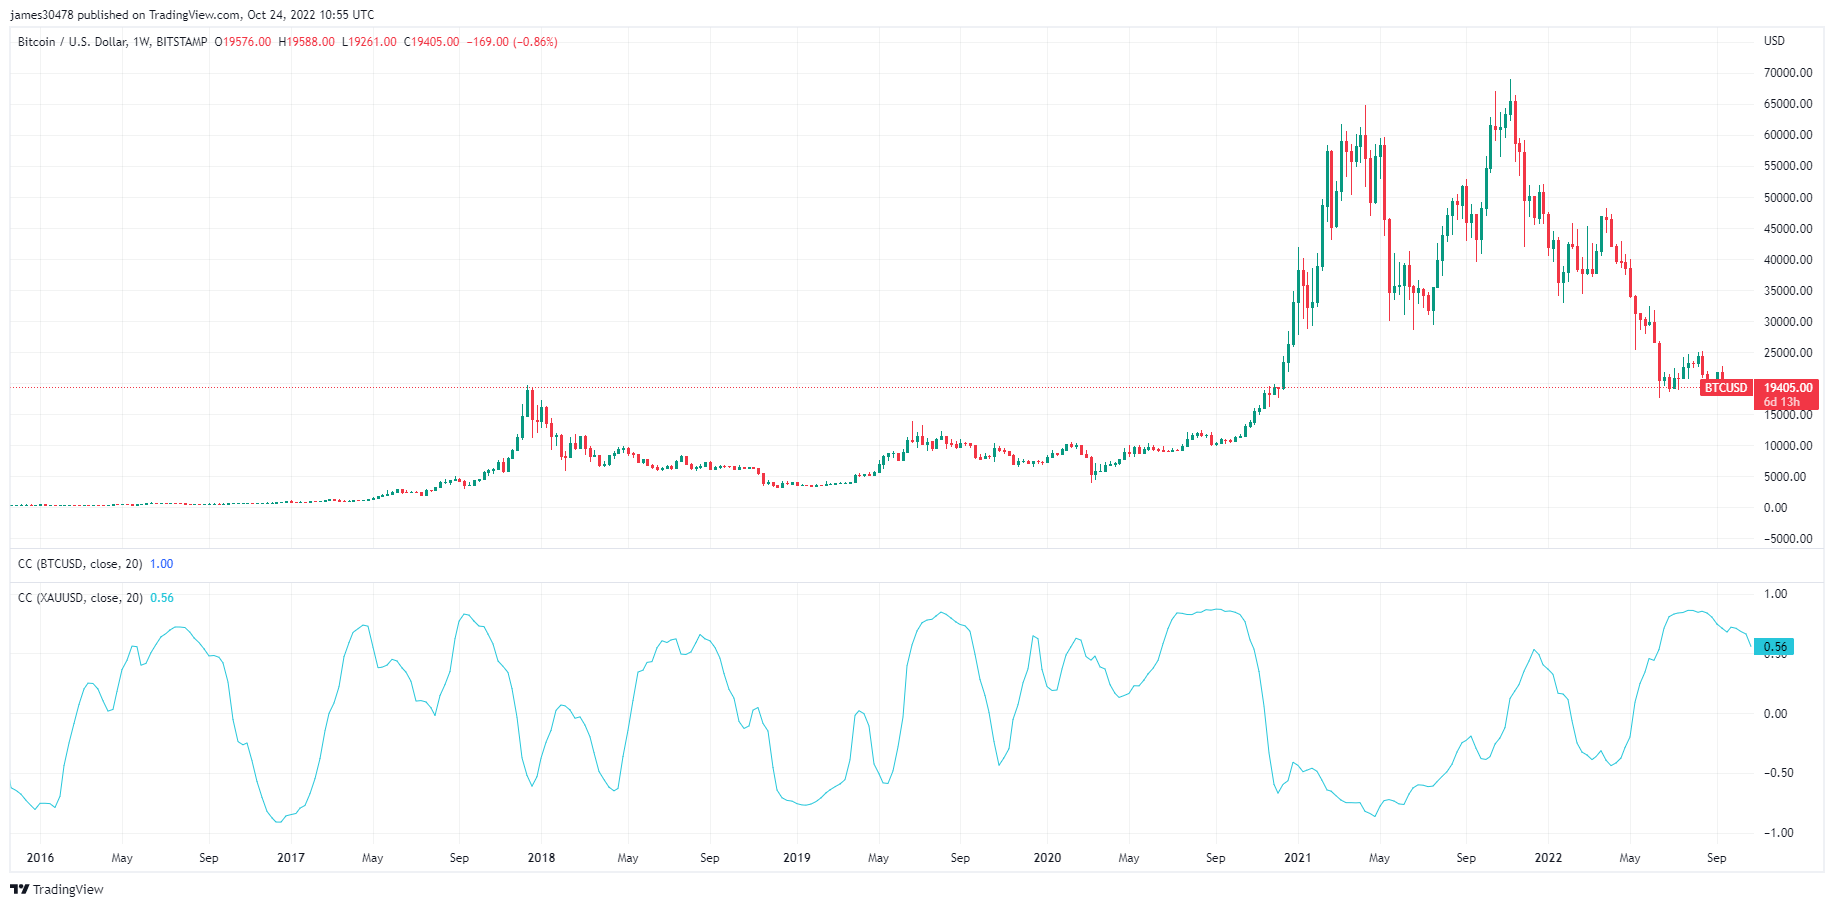
Historical data on the Bitcoin and gold correlation suggests that times of high correlation presage a price bottom for Bitcoin.
The chart below shows Bitcoin’s price against the U.S. Dollar since 2018 and demonstrates the blue line’s correlation rate between gold and Bitcoin.
The chart’s sections showing the price movements in late 2017, July 2018, September 2018, August 2019, January 2020, March 2020, July-October 2020, December 2021, and July 2022 correspond with a relatively high price correlation between gold and Bitcoin.
Equities & Volatility Gauge
The Standard and Poor’s 500, or simply the S&P 500, is a stock market index tracking the stock performance of 500 large companies listed on exchanges in the United States. S&P 500 3,901 3.27% (5D)
The Nasdaq Stock Market is an American stock exchange based in New York City. It is ranked second on the list of stock exchanges by market capitalization of shares traded, behind the New York Stock Exchange. NASDAQ 11,546 1.93% (5D)
The Cboe Volatility Index, or VIX, is a real-time market index representing the market’s expectations for volatility over the coming 30 days. Investors use the VIX to measure the level of risk, fear, or stress in the market when making investment decisions. VIX 26 -16.12% (5D)
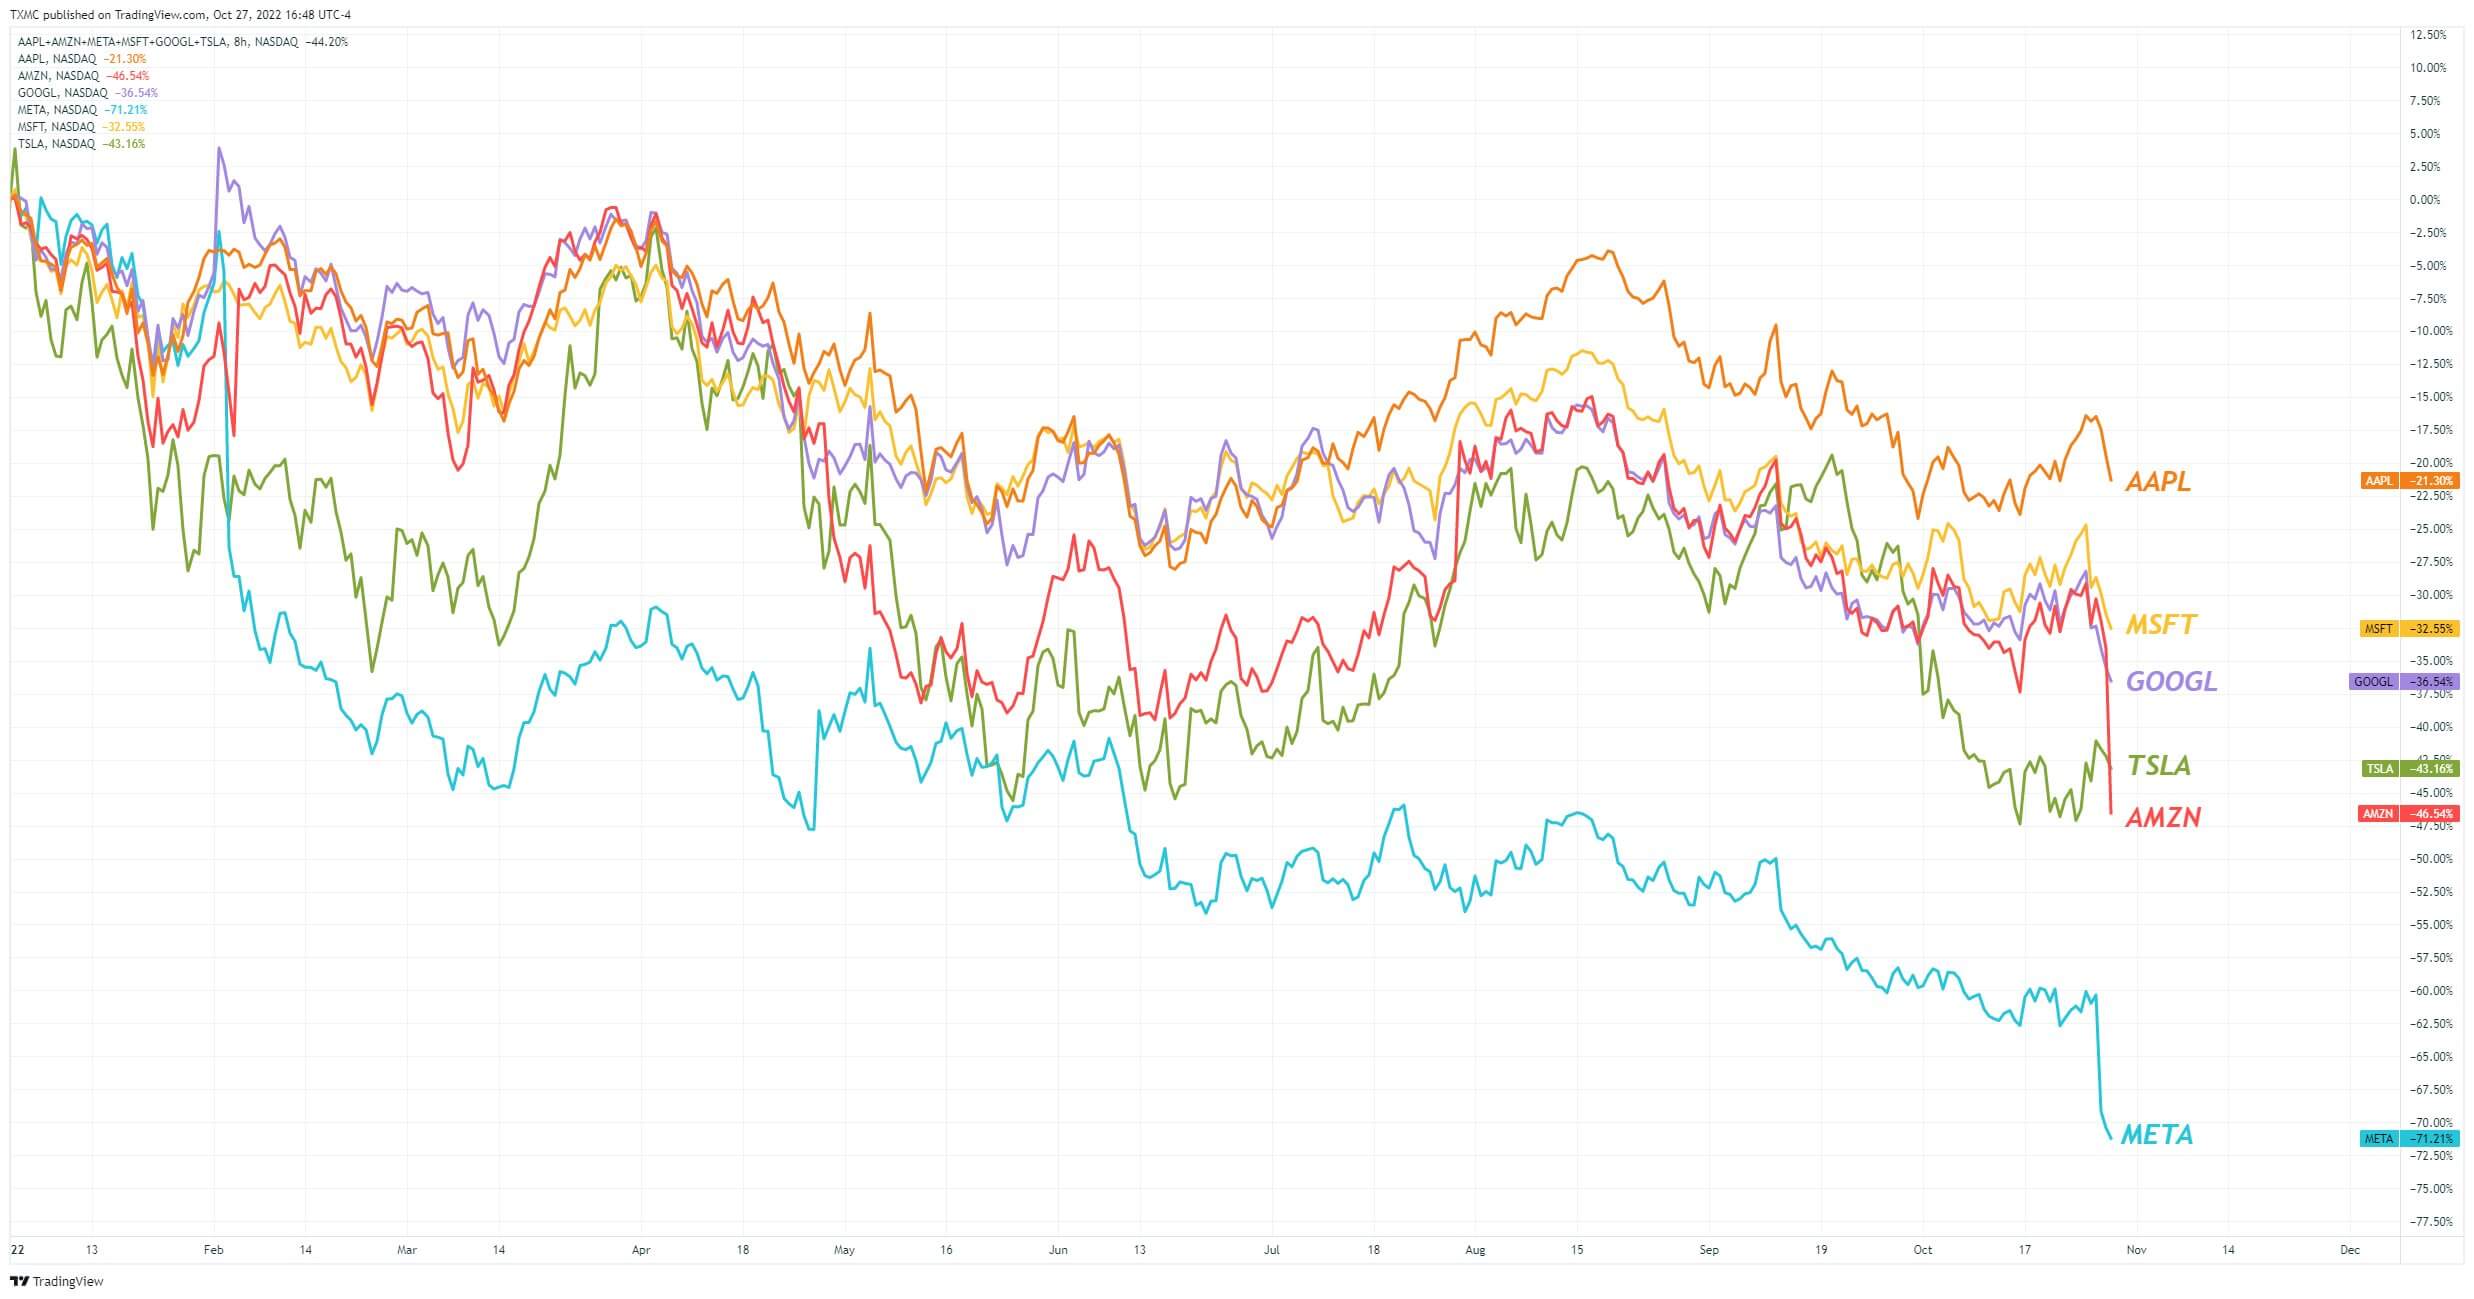
Big miss for big tech
It was big tech earnings season, the week commencing Oct. 24, and to put it mildly, it didn’t go well. Meta shares plunged 20% after hours after missed earnings, and its fourth-quarter forecast was at the lower end of expectations. Meta was currently 72% down from its all-time high at similar price levels back in 2016.
Meta’s market value has collapsed by $520 billion in the past year and is on the brink of dropping out of the top 20 largest U.S. companies.
Alphabet and Microsoft shares fell 5% and 7% after failing to meet expectations after posting its weakest quarterly revenue growth in five years. While Amazon’s share price plummeted 20% after hours as they had a poor Q3 and saw over $200bn of value wiped out in 5 minutes.
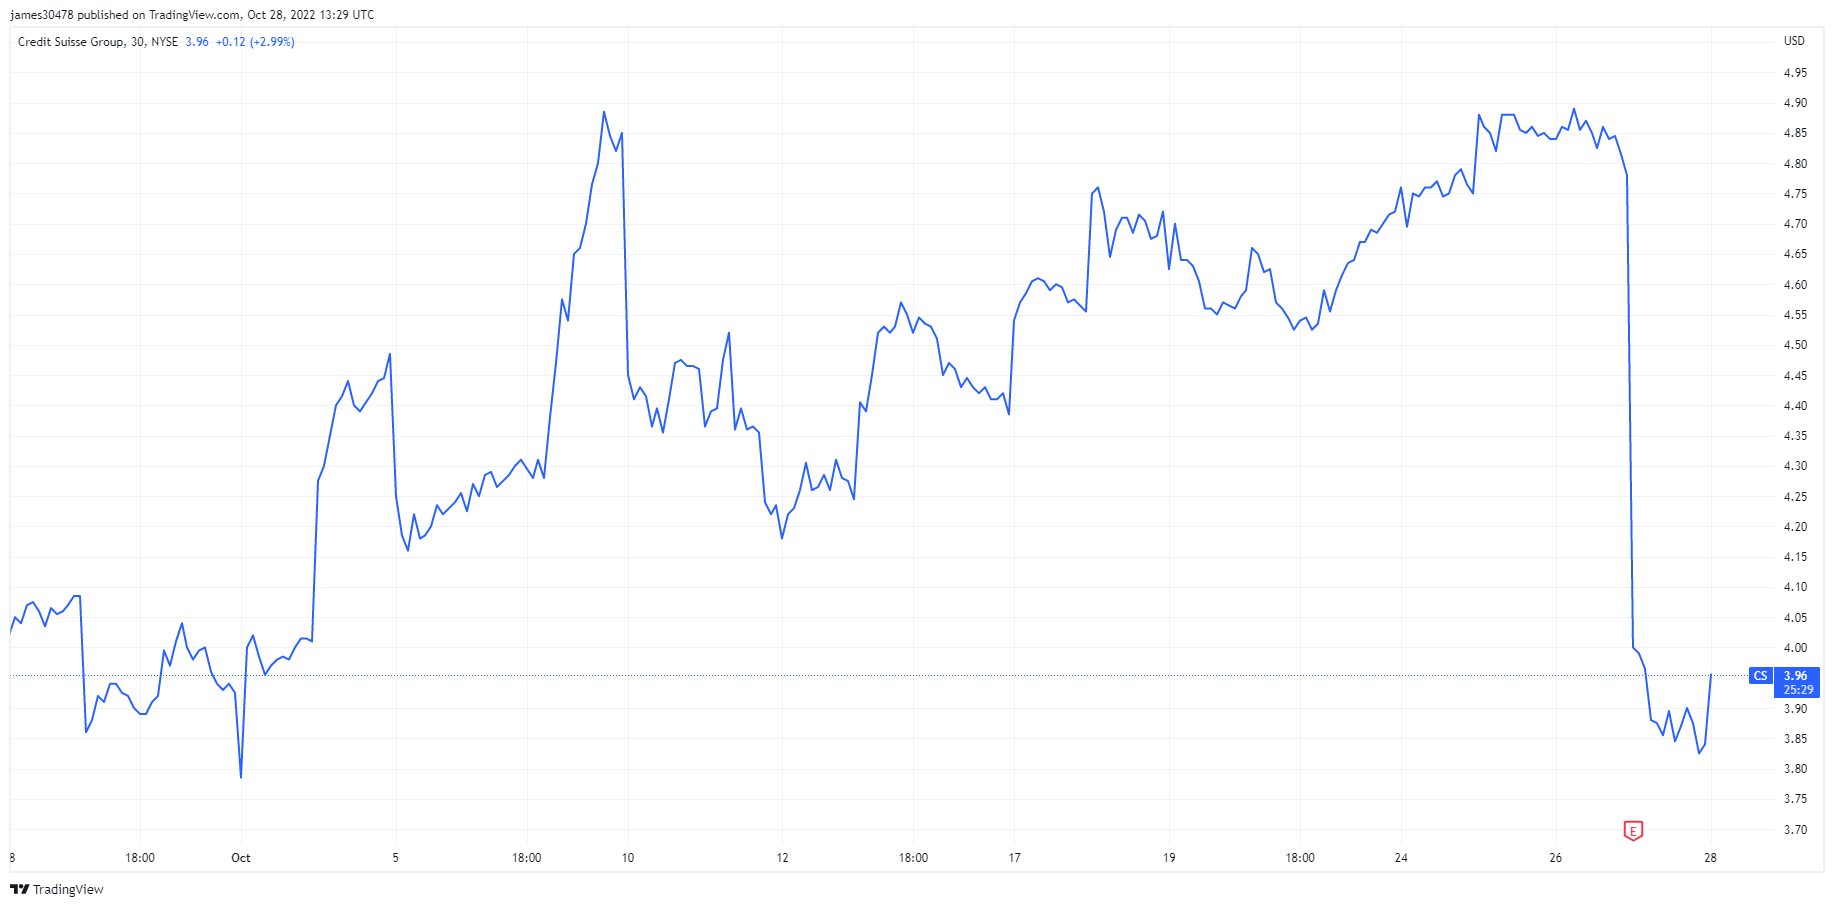
Cracks appear in Credit Suisse
Credit Suisse’s share price tanked 19% on Oct. 27 after a poor Q3 performance. The “radical” and “decisive” senior management proposals for restructuring the bank – which include a capital raise and firing 9,000 employees (17%) of the workforce, had a detrimental effect on the share price, down 19%.
Commodities
The demand for gold is determined by the amount of gold in the central bank reserves, the value of the U.S. dollar, and the desire to hold gold as a hedge against inflation and currency devaluation, all help drive the price of the precious metal. Gold Price $1,644 -1.02% (5D)
Similar to most commodities, the silver price is determined by speculation and supply and demand. It is also affected by market conditions (large traders or investors and short selling), industrial, commercial, and consumer demand, hedge against financial stress, and gold prices. Silver Price $19 -1.23% (5D)
The price of oil, or the oil price, generally refers to the spot price of a barrel (159 litres) of benchmark crude oil. Crude Oil Price $88 3.44% (5D)
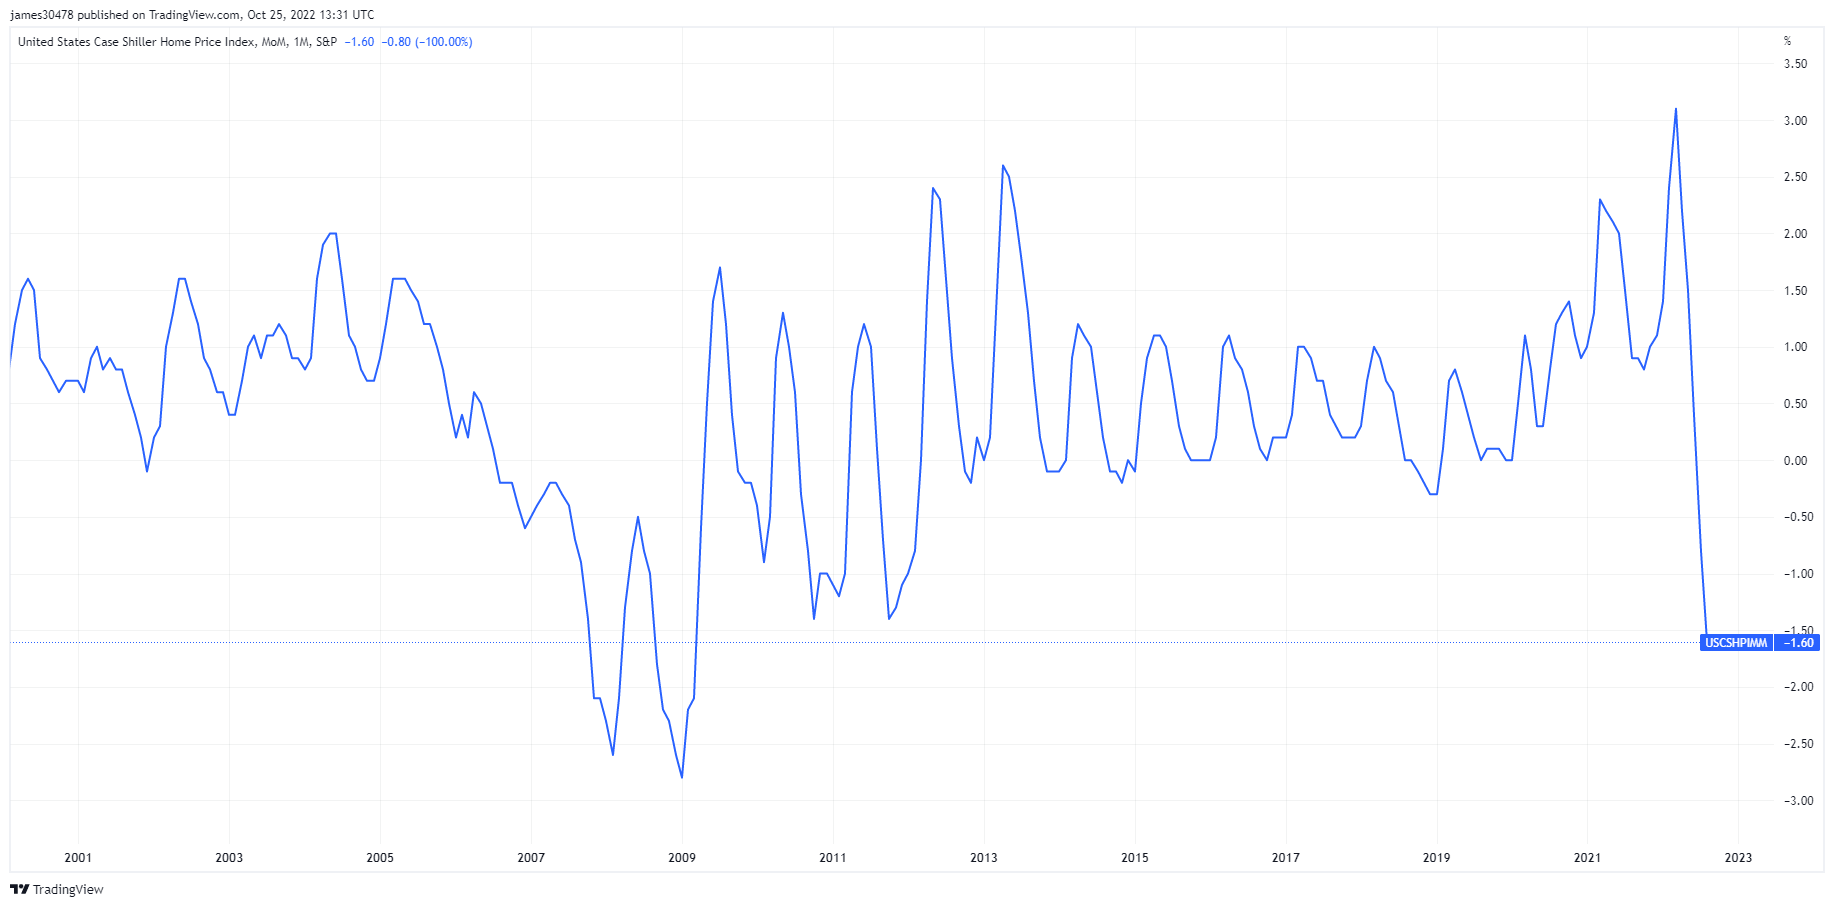
U.S. home prices continue to decline
U.S. home prices continue to get hammered and have fallen for the second straight month in August. The Case-Shiller Index suggests that house prices fell by 1.3% in August, the most significant decline since 2009. However, the index is still up +13% YOY, subsequently;
- Mortgage rates are at a 20-year high
- Mortgage rates accelerating at historic paces
- Mortgage applications at multi-decade lows
The Case-Shiller data is a lagging indicator, assuming more significant declines are to come.
Rates & Currency
The 10-year Treasury note is a debt obligation issued by the United States government with a maturity of 10 years upon initial issuance. A 10-year Treasury note pays interest at a fixed rate once every six months and pays the face value to the holder at maturity. 10Y Treasury Yield 4.016% -4.86% (5D)
The U.S. dollar index is a measure of the value of the U.S. dollar relative to a basket of foreign currencies. DXY 110.668 -1.27% (5D)
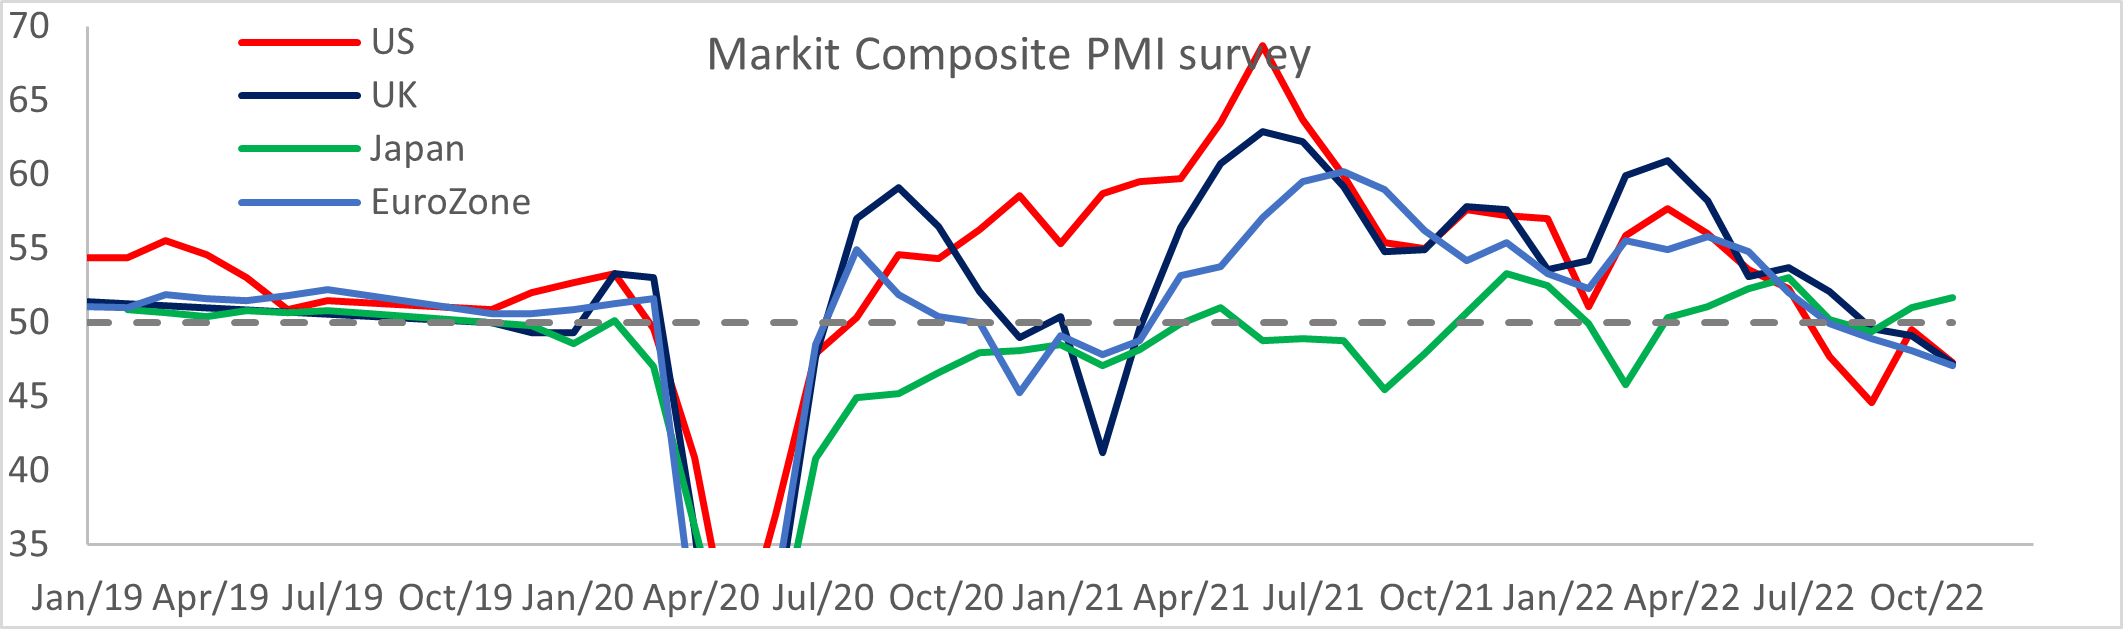
PM Sunak inherits a recession
Rishi Sunak became the U.K prime minister on Oct.24, and some form of stability has been formed in the U.K markets. Significant decline in gilt yields, especially in the longer end of the yield curve, which had many pensions margin called at the beginning of October due to a rise in subsequent years’ tax increases.
The slump continued in the S&P composite PMI fell to 47.2, signaling a significant contraction for the first time since February 2021, which also sees U.S and Eurozone in contraction.
Markets expect a 75 bps hike for the BOE next week, increasing the base rate to 3%.
Bitcoin Overview
The price of Bitcoin (BTC) in USD. Bitcoin Price $20,920 8.43% (5D)
The measure of Bitcoin’s total market cap against the larger cryptocurrency market cap. Bitcoin Dominance 40.83% -2.15% (5D)
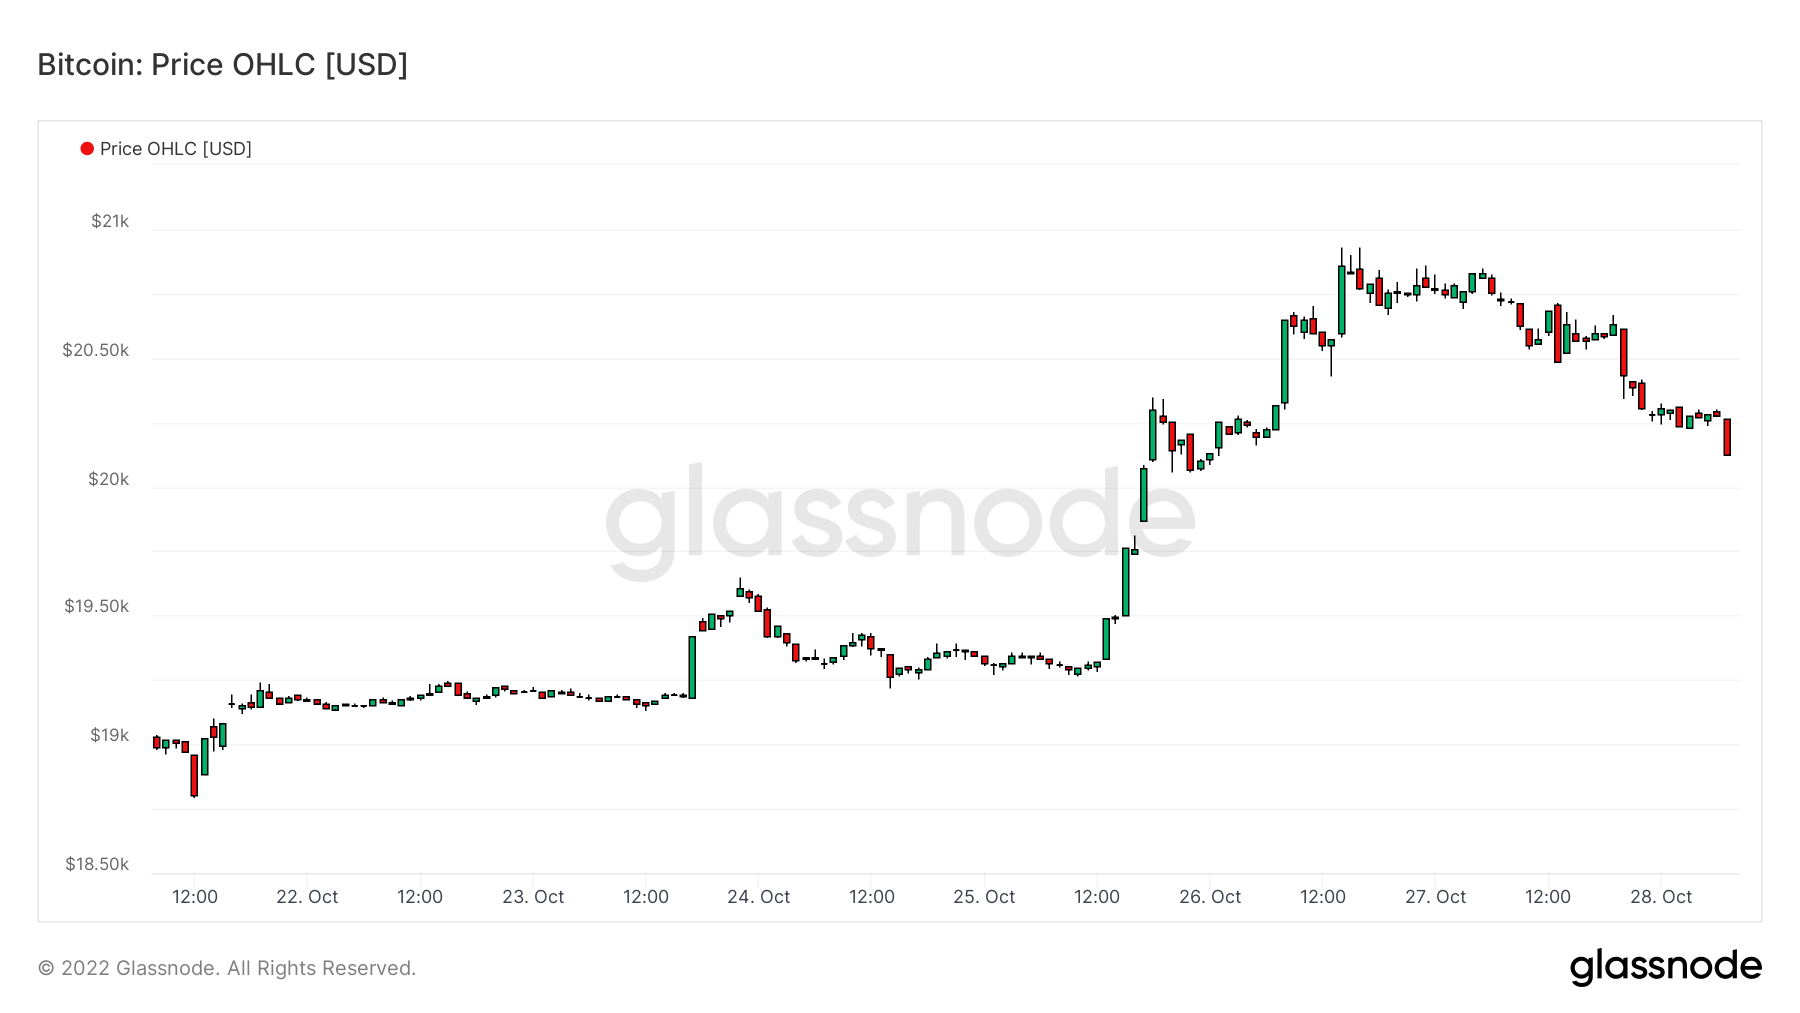
- BTC broke $21k for the first time since Oct. 4.
- BTC mining difficulty adjusts +3%.
- Public miner Core Scientific is halting all debt financing payments and is left with 24 BTC in their treasury; they had over 10k BTC in April,
- 100k BTC has left exchanges for four consecutive days contributing to the positive price action.
- U.S. and E.U. have started to accumulate BTC for the first time in two months.
Dervatives
A derivative is a contract between two parties which derives its value/price from an underlying asset. The most common types of derivatives are futures, options and swaps. It is a financial instrument which derives its value/price from the underlying assets.
The total amount of funds (USD Value) allocated in open futures contracts. Futures Open Interest $12.37B -2.39% (5D)
The total volume (USD Value) traded in futures contracts in the last 24 hours. Futures Volume $31.31B $28.56 (5D)
The sum liquidated volume (USD Value) from short positions in futures contracts. Total Long Liquidations $110M $64.54M (5D)
The sum liquidated volume (USD Value) from long positions in futures contracts. Total Short Liquidations $660M $621.24M (5D)
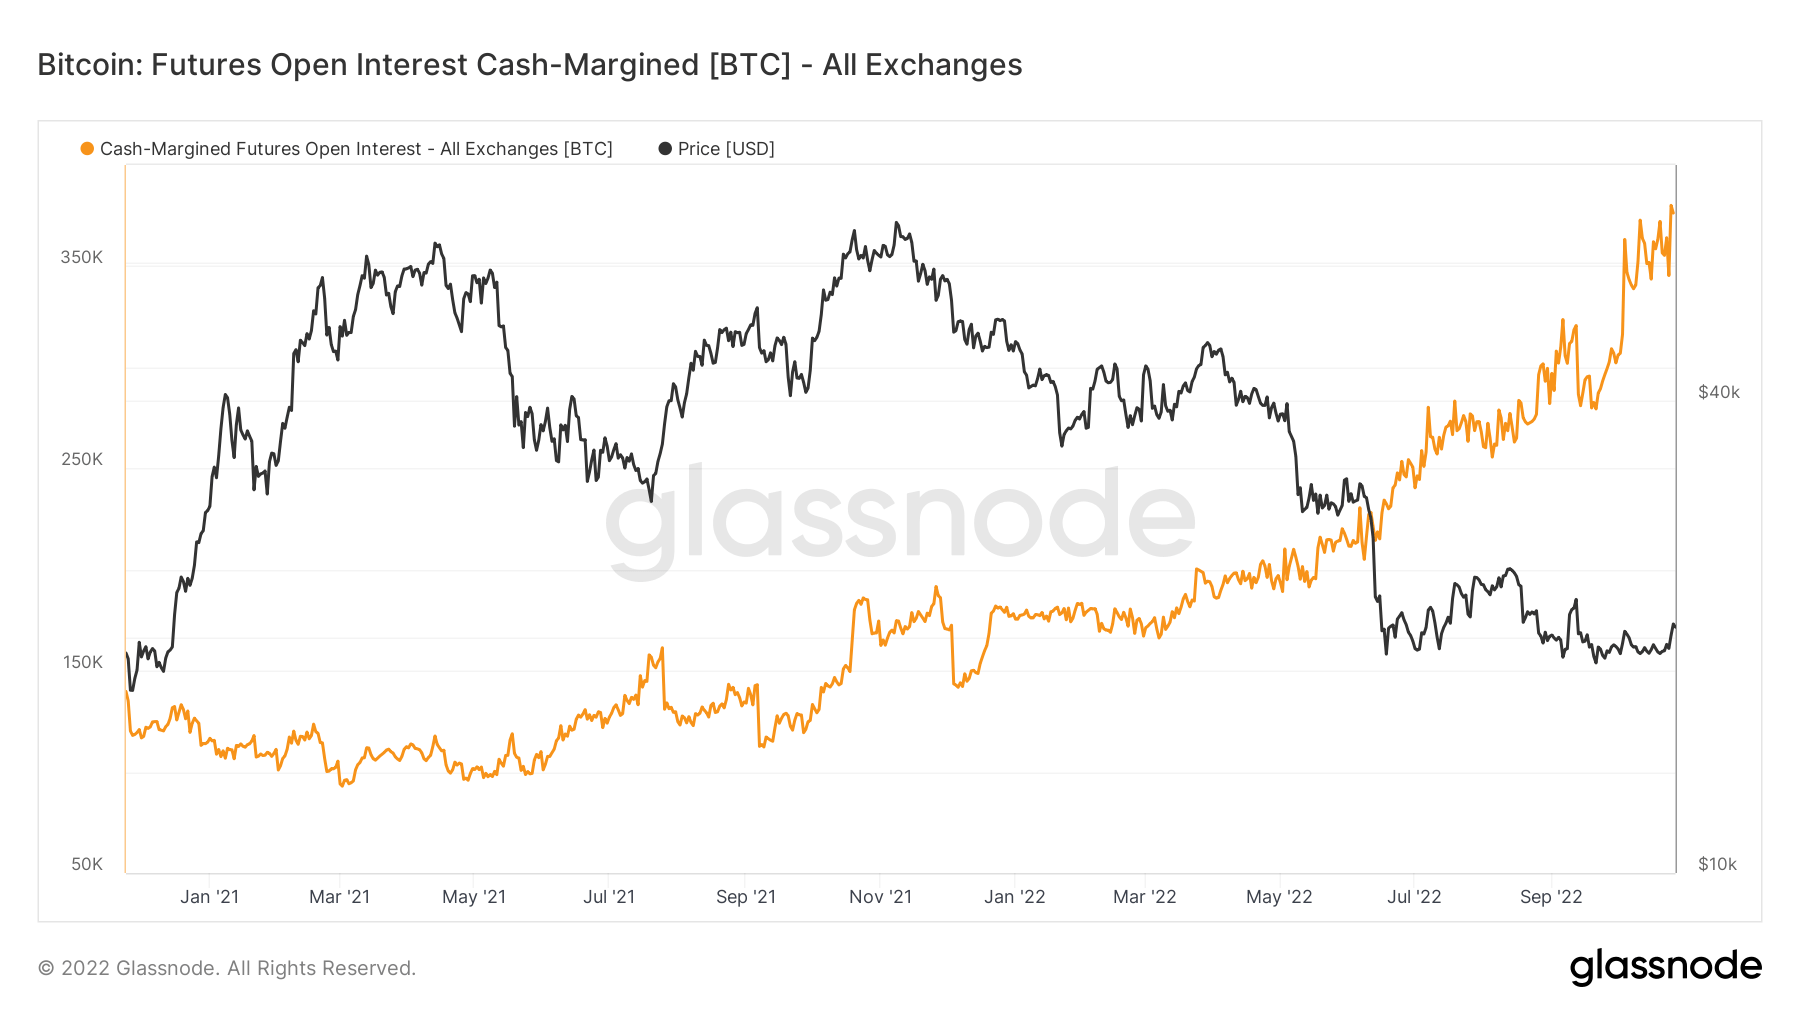
Liquidations galore as leverage stays at all-time highs
Since the end of September, futures open interest in cash margin (total amount of futures contracts open interest that is margined in USD or USD-pegged stablecoins. Stablecoins include USDT and BUSD) continues to make all-time highs, 380k BTC denominated. Investors are using cash instead of crypto as the underlying collateral is a safer play due to less underlying volatility.
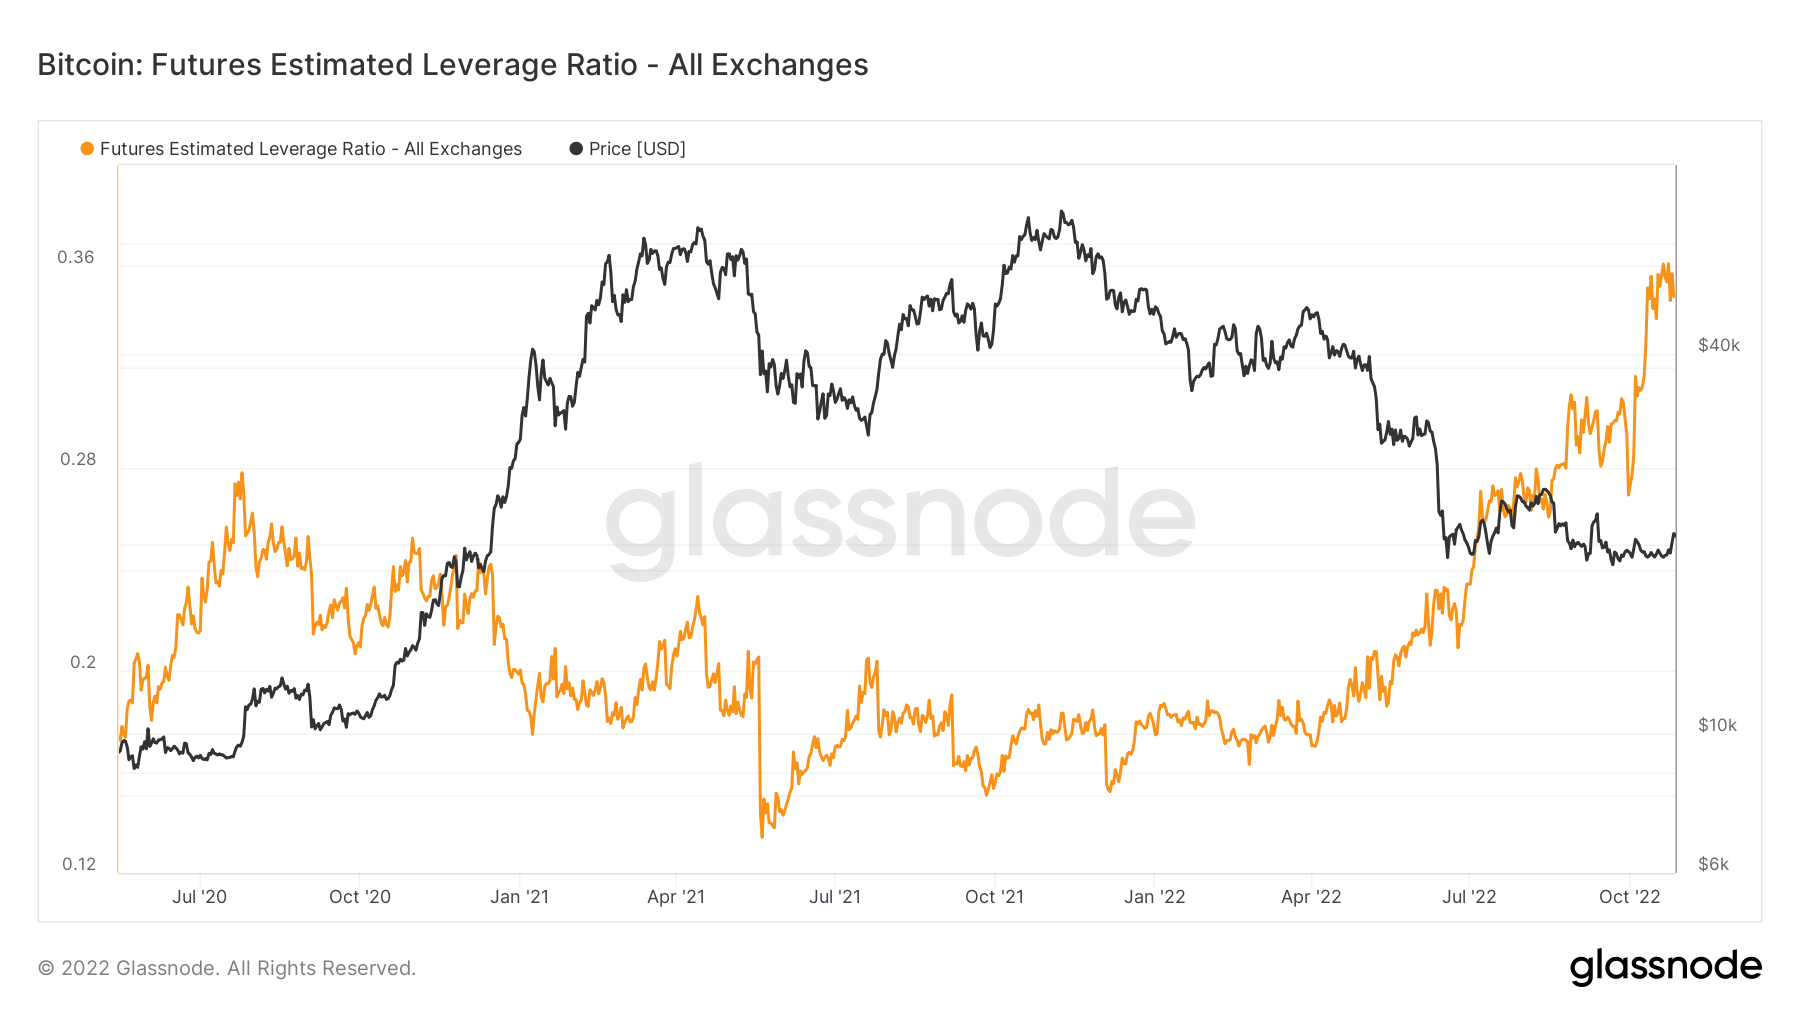
However, this has caused the futures estimated leverage ratio to climb to an all-time high of 0.34, defined as the ratio of the open interest in futures contracts and the balance of the corresponding exchange. A lot of leverage is sitting in contracts that need to be unwound.
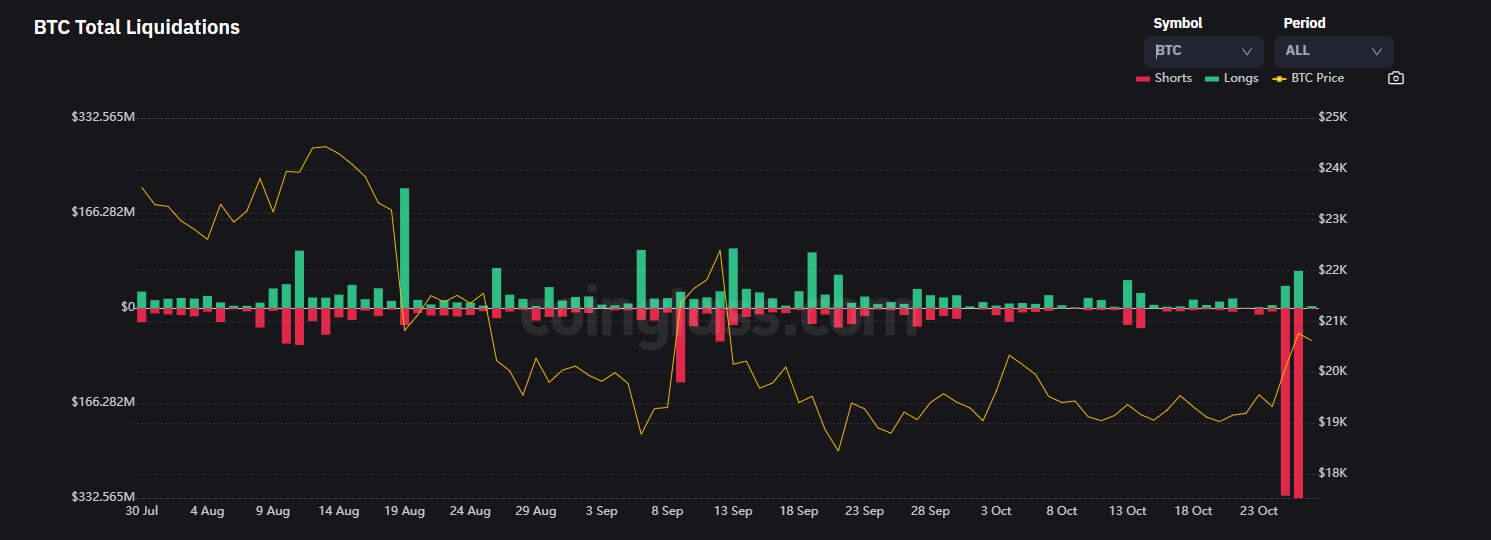
As a result, FTX saw the two largest liquidations in its history. Low volatility and a high-leverage market pushed bears to the worst liquidation event of this current bear market cycle. As of Oct. 25 and 26, the number of liquidations short and long Bitcoin jumped to over $776m in 48 hours, but adding other coins; it saw a total of over $1.5bn.
Miners
Overview of essential miner metrics related to hashing power, revenue, and block production.
The average estimated number of hashes per second produced by the miners in the network. Hash Rate 247 TH/s -5.73% (5D)
The total supply held in miner addresses. Miner Balance 1,831,100 BTC 0.03% (5D)
The total amount of coins transferred from miners to exchange wallets. Only direct transfers are counted. Miner Net Position Change -30,017 BTC -6,869 BTC (5D)
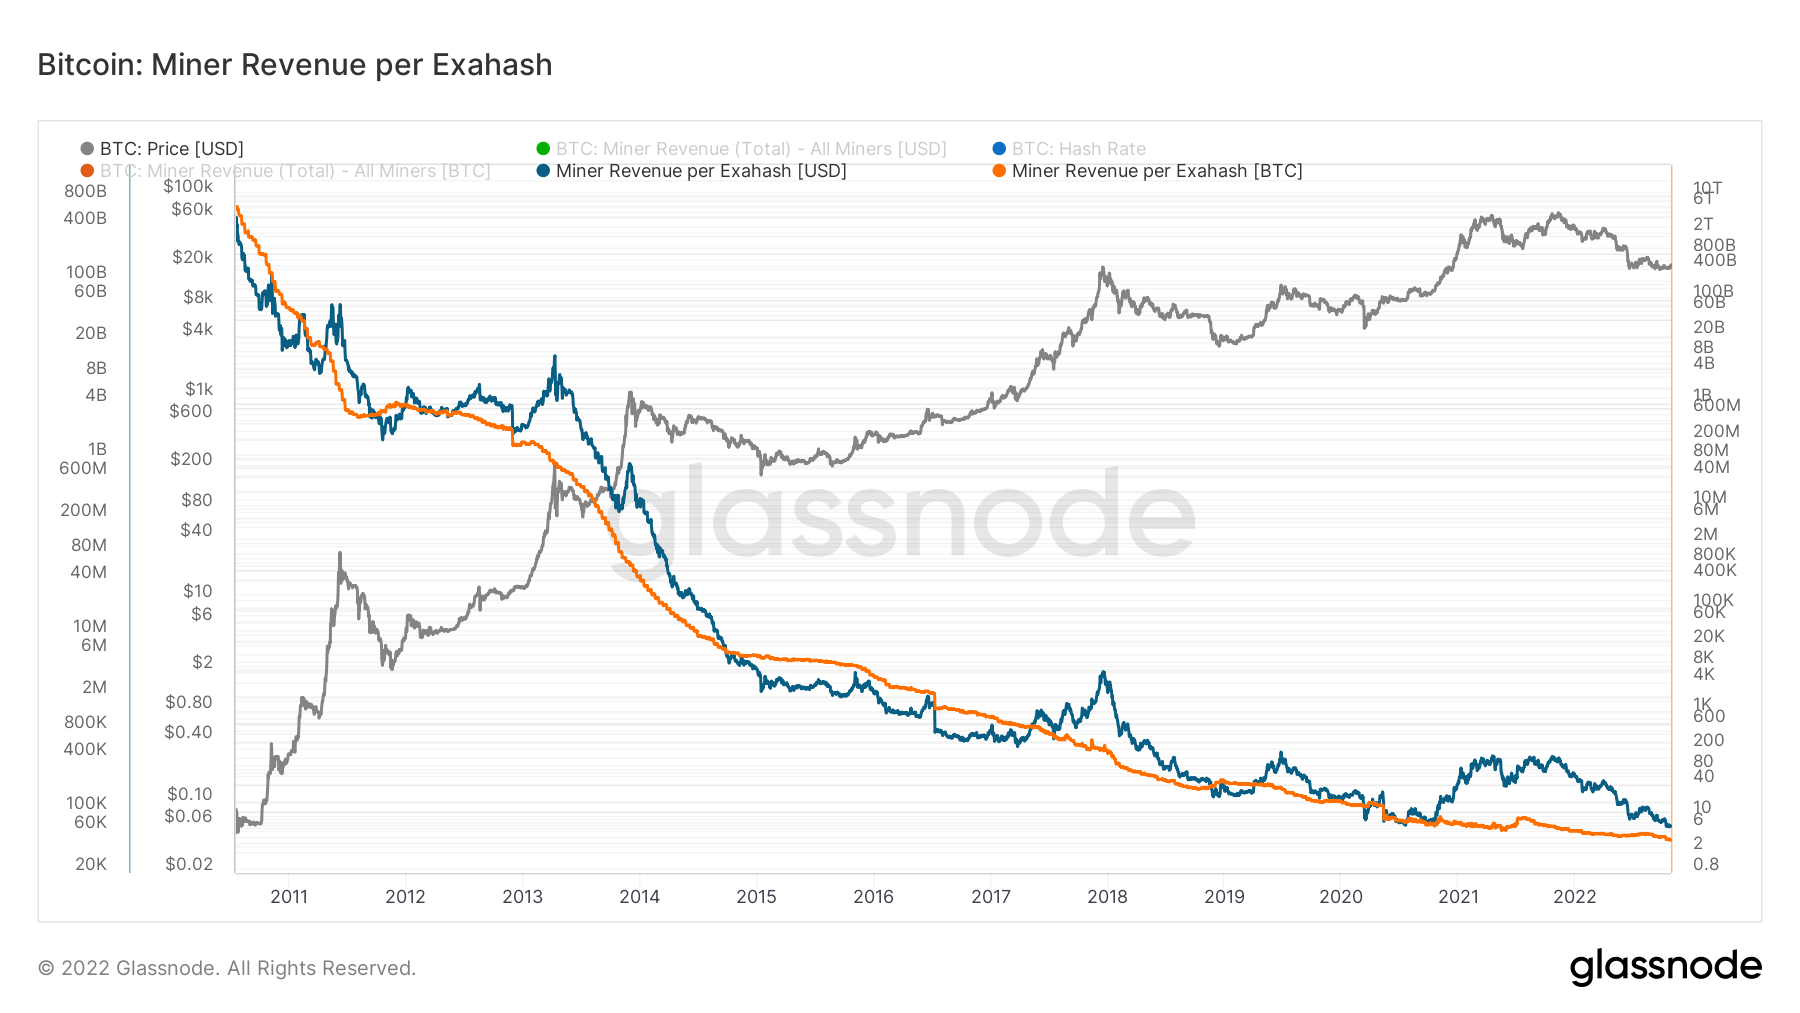
It looks bleak for miners
For the past few months, Bitcoin hash rate and difficulty have been soaring, which puts further pressure on miners and their revenue. The hash price is miner revenue divided by hash rate, is at a similar low compared to the 2020 cycle even though BTC is trading roughly double in price it shows that hash rate competition is fierce, and mining is a zero-sum game, survival of the fittest.
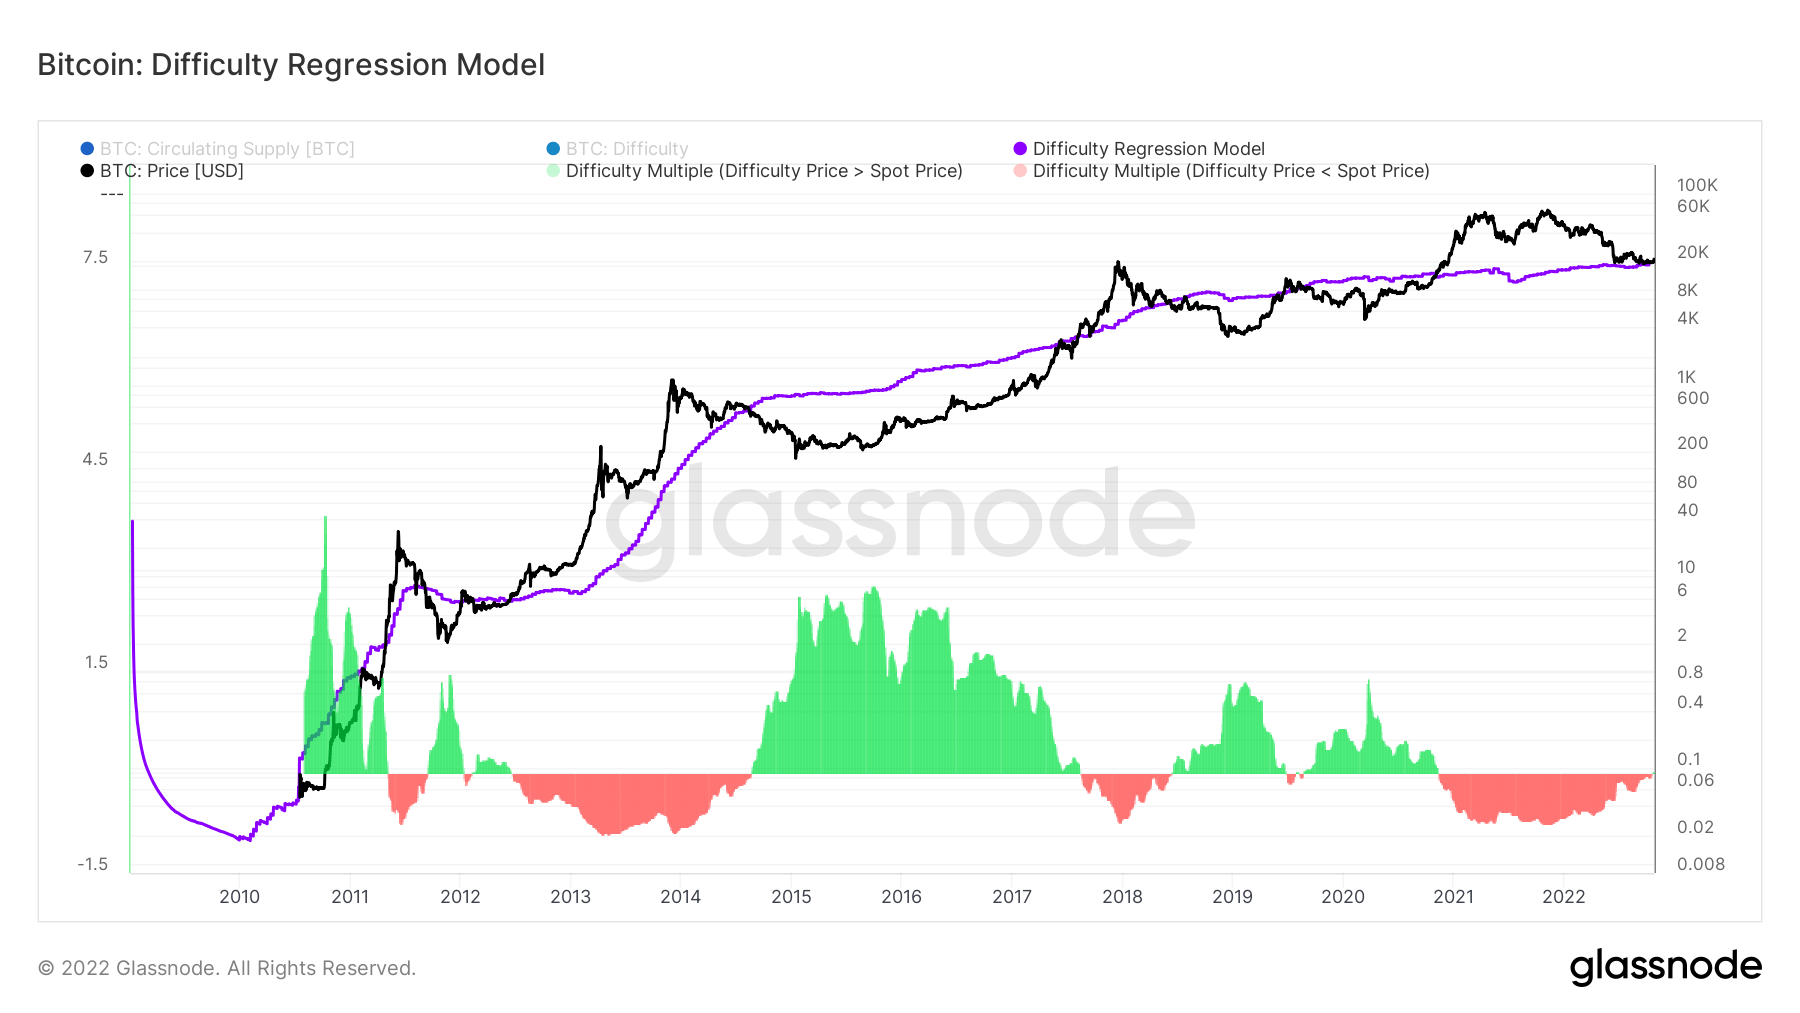
To further reinforce the issue for miners, the cost of producing one Bitcoin is becoming more expensive, with hash rate and difficulty continuing to hit all-time highs. The difficulty regression model created by glassnode breaks down all the costs for producing one Bitcoin. Currently, the cost of production is just over $19k. It is similar to 2018, when the price and regression models overlapped, coinciding with a mining capitulation that lasted almost several months.
Core Scientific halts debt financing payments
According to an SEC Filing, Core Scientific, one of the world’s largest Bitcoin mining firms, halts all debt financing payments.
“The Company anticipates that existing cash resources will be depleted by the end of 2022 or sooner….” “Given the uncertainty regarding the financial condition, substantial doubt exists about the Company’s ability to continue as a going concern for a reasonable period.”
As of Oct. 26, the company holds just 24 BTC and approximately $26.6 million in cash. This contrasts with September, when it had over 1,000 BTC and $29.5 million in cash.
In its 8-K filing, the company said its board has decided not to make payments due in late October and early November. The prices include equipment purchases, financings, and two bridge promissory notes.
Core Scientific said it explored several potential strategies to resolve insolvency issues. These strategies include hiring additional strategic advisors, raising additional capital, and restructuring its existing capital structure. It will also explore liability management transactions, including exchanging its current debt for equity. Bankruptcy remains a viable option as well, the company said in the filing.
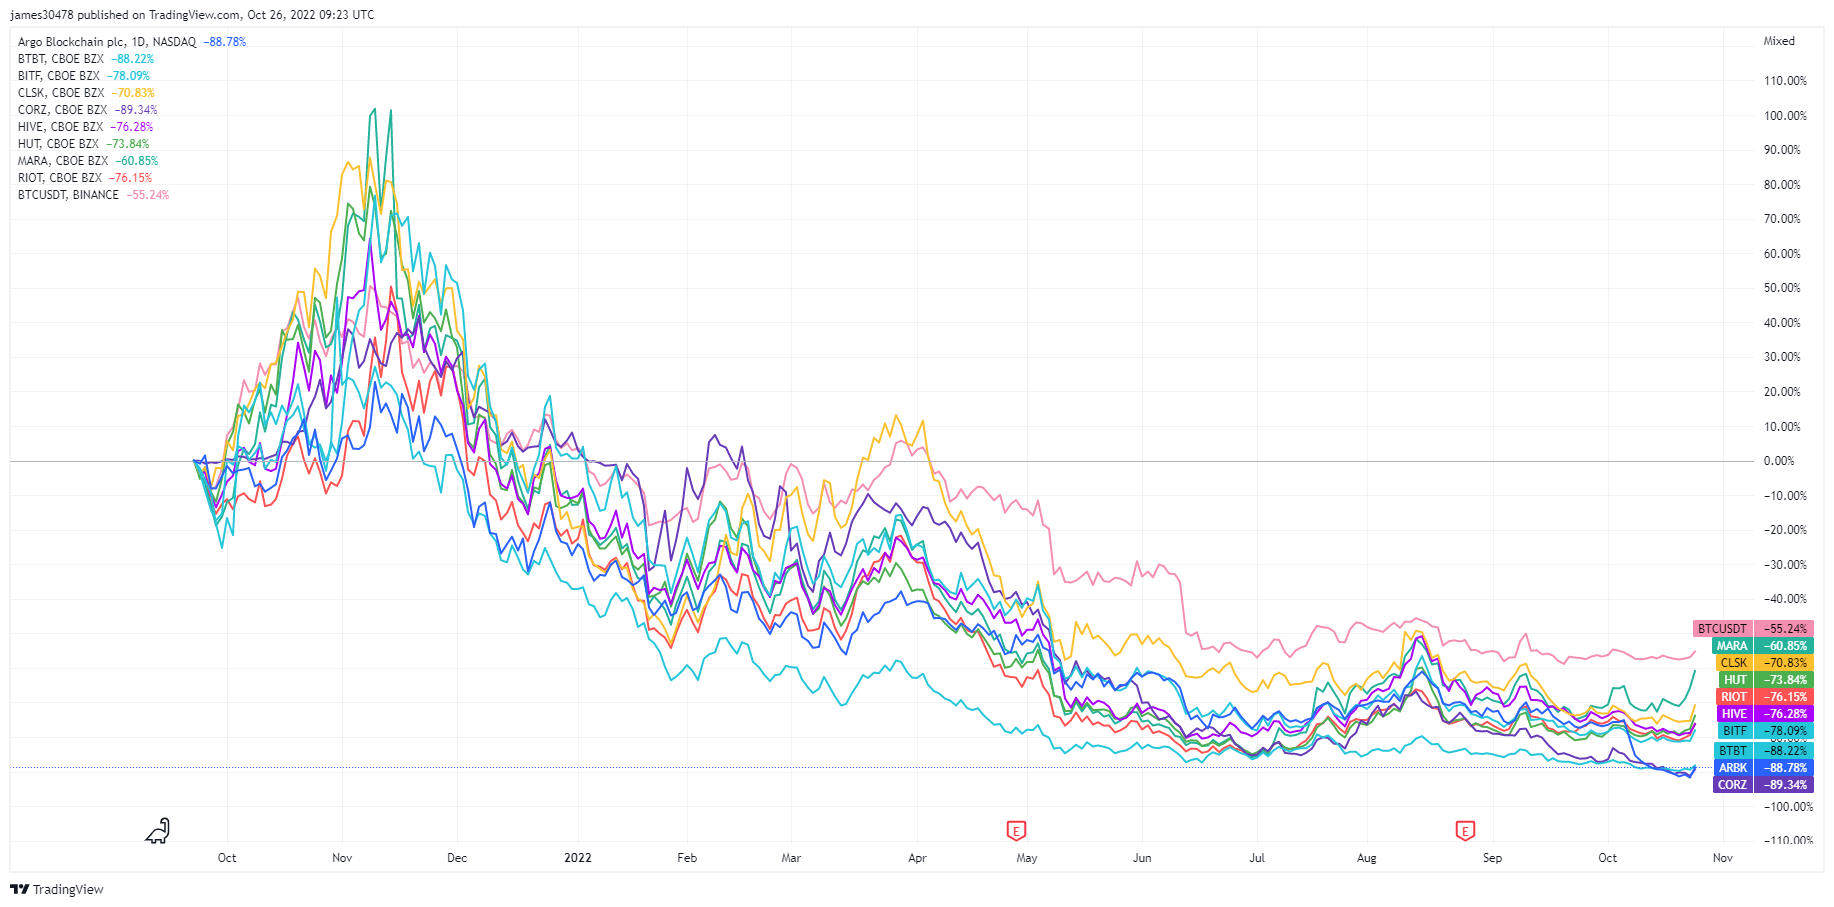
Core Scientific is roughly 90% down from its all-time high; this won’t be the last we hear of distressed miners.
On-Chain Activity
Collection of on–chain metrics related to centralized exchange activity.
The total amount of coins held on exchange addresses. Exchange Balance 2,356,473 BTC -45,089 BTC (5D)
The 30 day change of the supply held in exchange wallets. Exchange Net Position Change 281,432 BTC -158,768 BTC (30D)
Bitcoin Entity Adjusted UTXO Realized Price Distribution
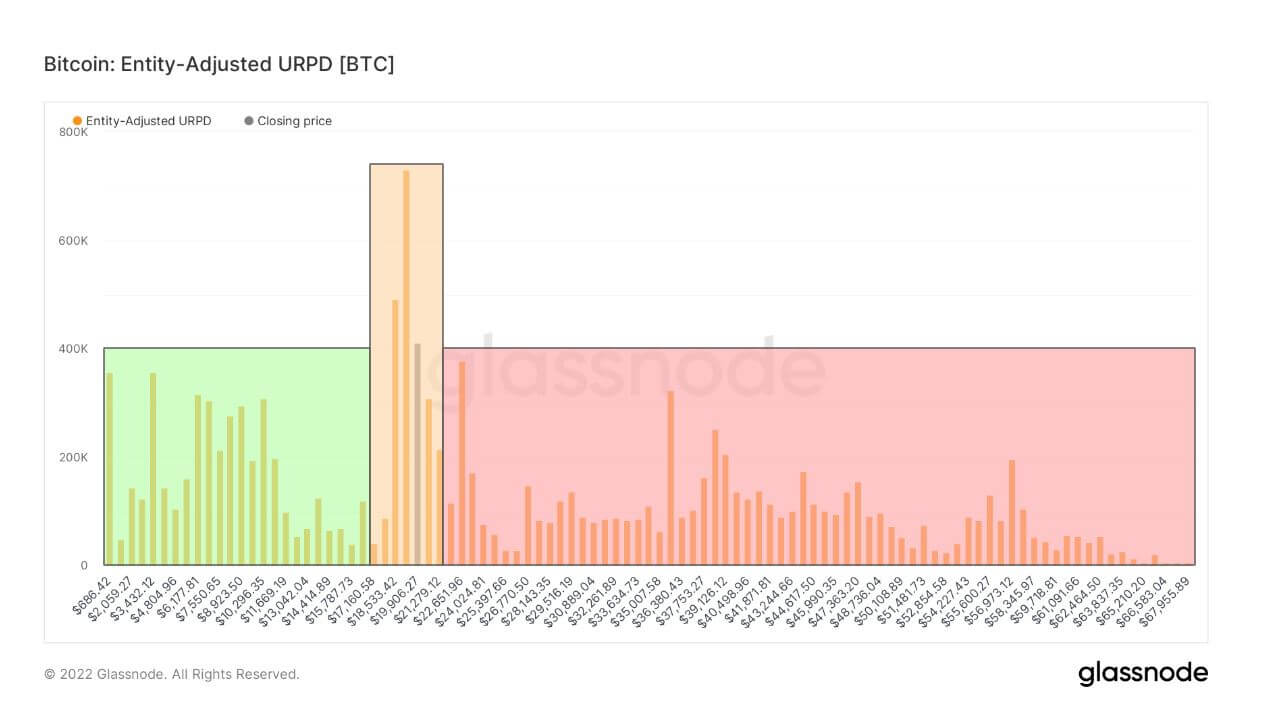
The UTXO Realized Price Distribution (URPD) metric shows the prices at which the current set of Bitcoin UTXOs were created.
Each bar in the chart below represents the number of existing Bitcoins that last moved within the respective price bucket. Being entity-adjusted, the average purchasing price is used for each entity to determine its balance within the specific bucket.
To derive a more representative chart, coin movements between addresses controlled by the same entity are disregarded. Similarly, exchange supply is excluded as a single averaged price for many multiple users would misrepresent the data giving rise to unwanted artifacts.
Investors who purchased Bitcoin at $17,600 or below represent only 25% of token holders, with 14% buying between 17.6k and 22K. Meanwhile, a staggering 61% of token holders were underwater at the market bottom.
Geo Breakdown
Regional prices are constructed in a two-step process: First, price movements are assigned to regions based on working hours in the US, Europe, and Asia. Regional prices are then determined by calculating the cumulative sum of the price changes over time for each region.
This metric shows the 30-day change in the regional price set during Asia working hours, i.e. between 8am and 8pm China Standard Time (00:00-12:00 UTC). Asia 5,199 BTC 1,475 BTC (5D)
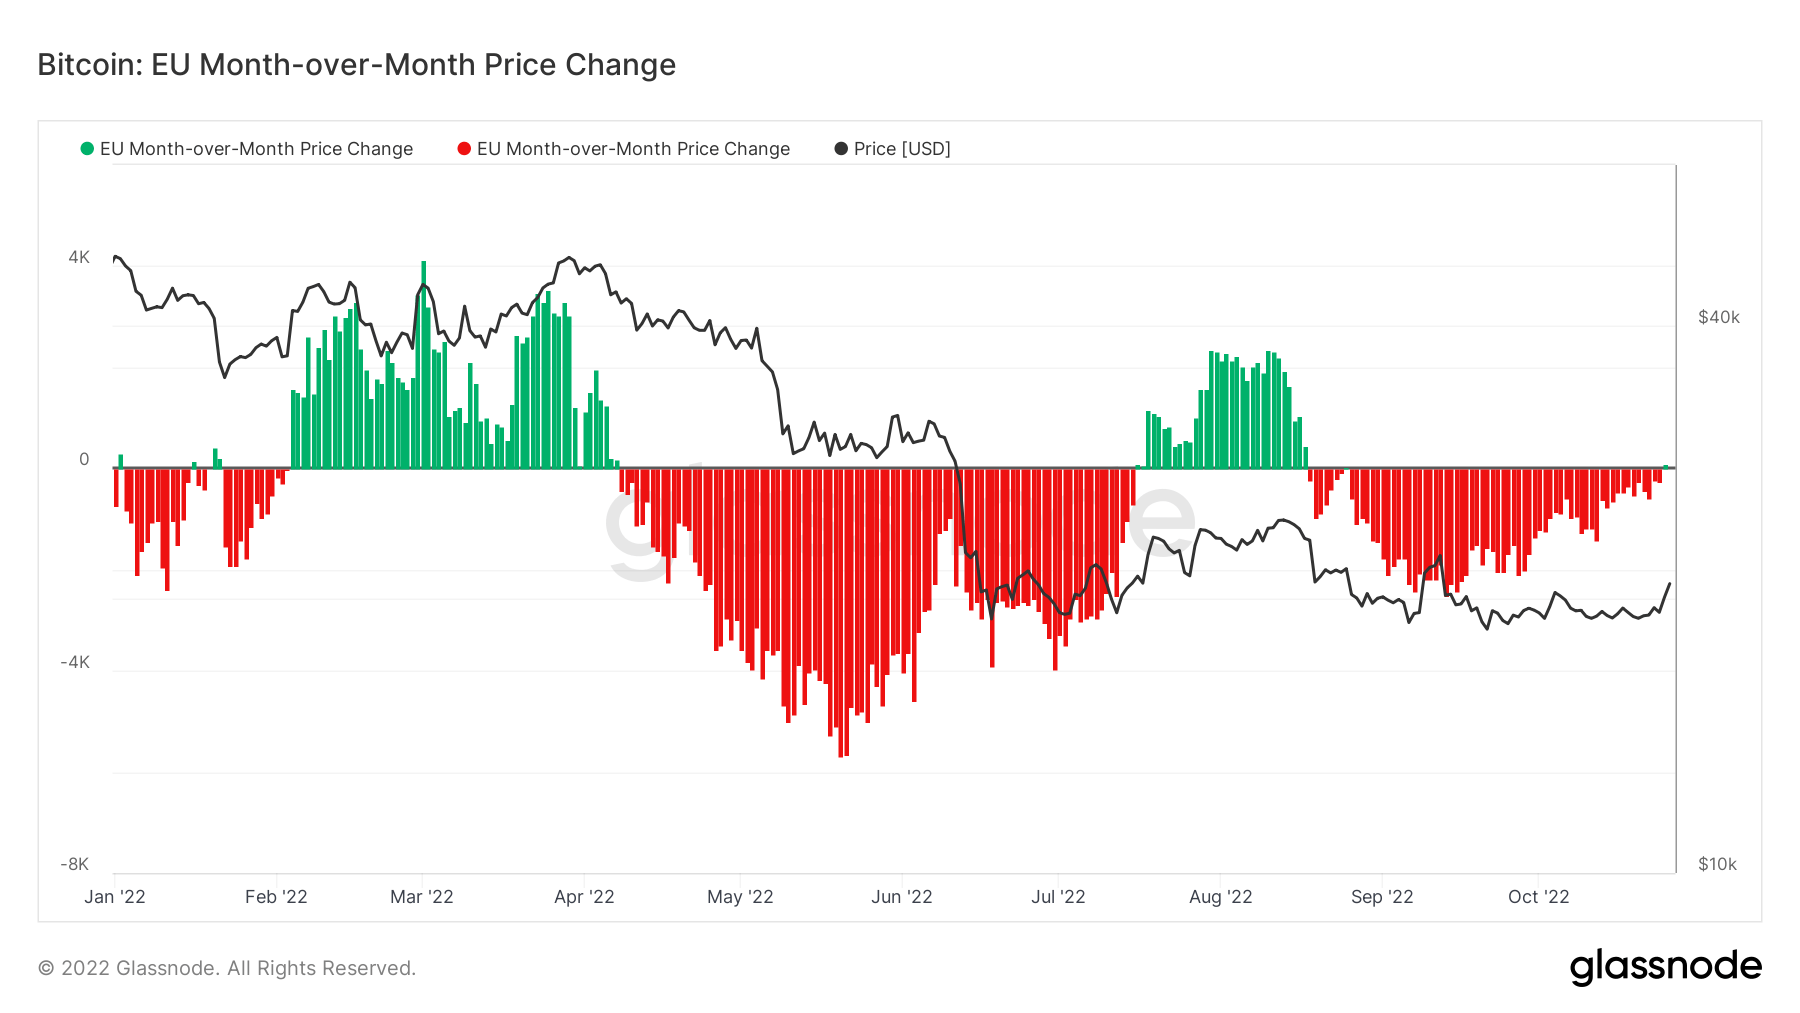
This metric shows the 30-day change in the regional price set during EU working hours, i.e. between 8am and 8pm Central European Time (07:00-19:00 UTC), respectively Central European Summer Time (06:00-18:00 UTC). Europe -563 BTC 2,901 BTC (5D)
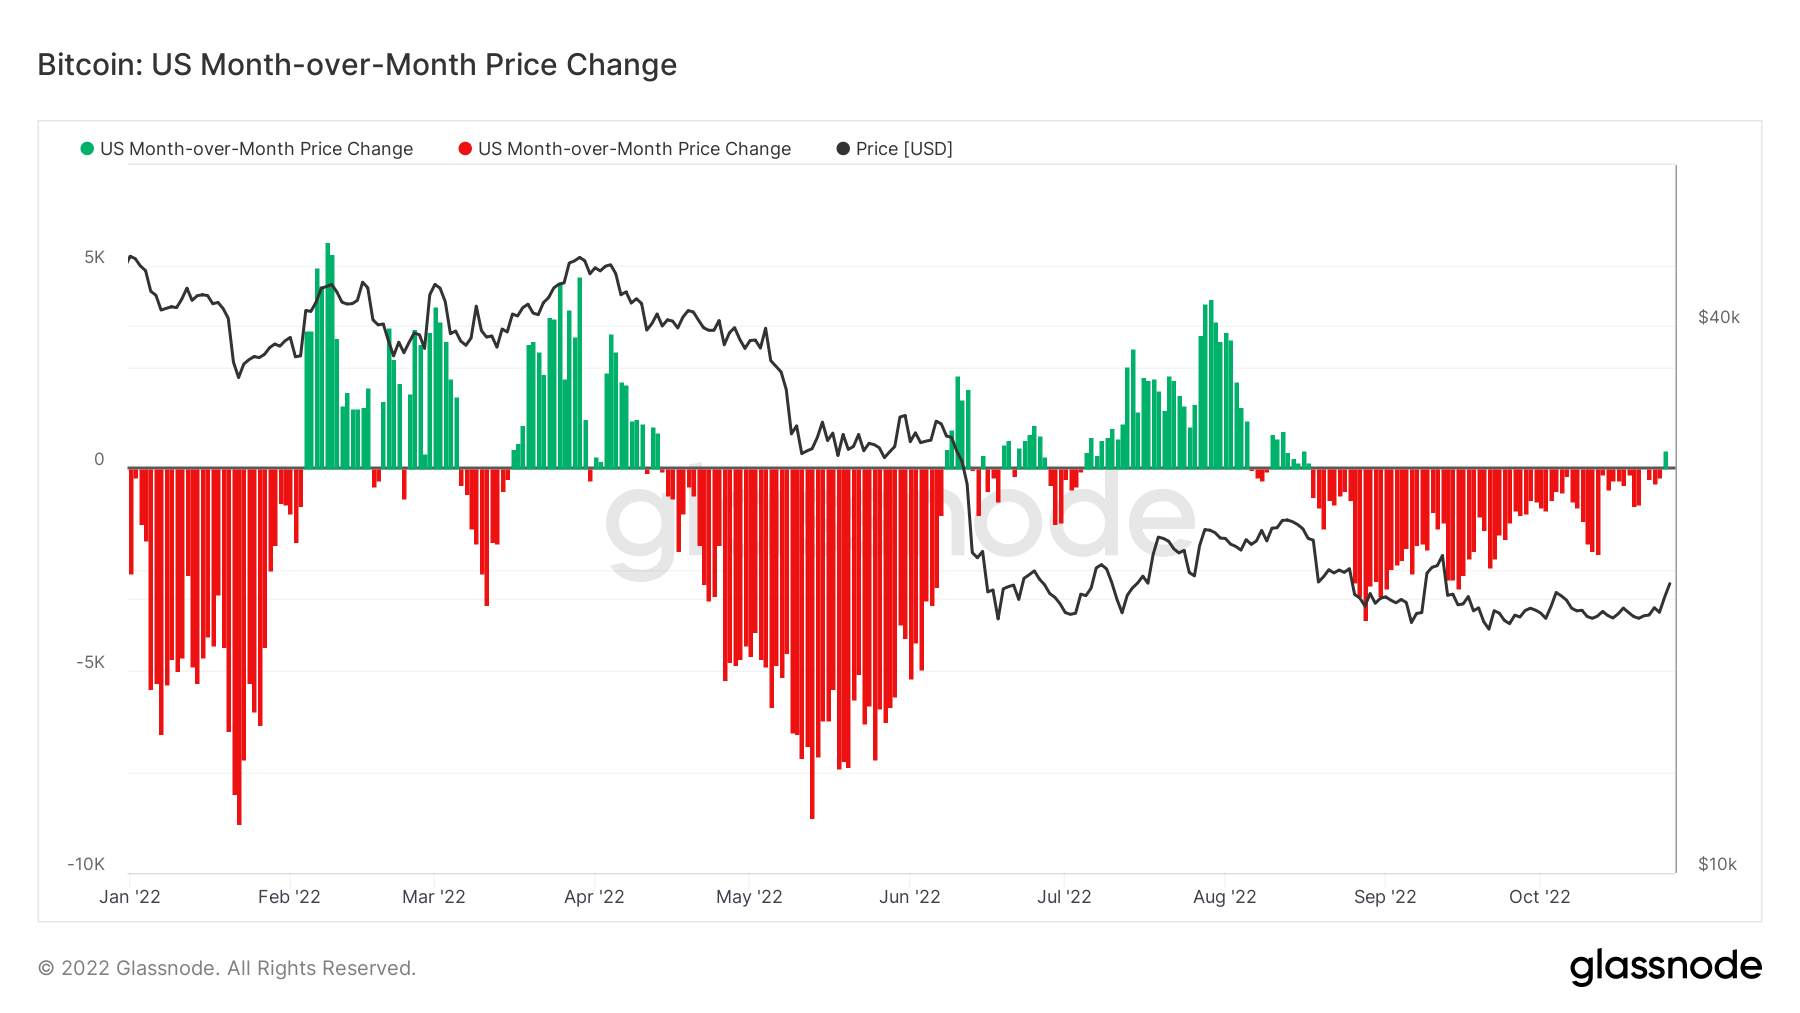
This metric shows the 30-day change in the regional price set during US working hours, i.e. between 8am and 8pm Eastern Time (13:00-01:00 UTC), respectively Eastern Daylight Time (12:00-0:00 UTC). U.S. 518 BTC 3,963 BTC (5D)
U.S. and E.U. lead Bitcoin’s price action
To determine when a market has been “buying” Bitcoin, Glassnode uses its month-over-month price change metric for Bitcoin. This metric shows the 30-day change in the regional price set during U.S. and E.U. working hours.
Regional prices are constructed by assigning regions based on working hours in various markets, such as Europe, Asia, and the U.S. The cumulative sum of the price changes over time is then calculated for each region to show whether traders have been buying or selling Bitcoin.
Bitcoin’s rally could have been a result of a significant increase in buying pressure from the U.S. and E.U. markets, which showed little interest in BTC in the past months. According to data from Glassnode, this is the first time since Aug. 16 that the U.S. and E.U. have bought BTC.
Historically, increased buying pressure in these two markets has correlated with price rallies.
Supply
The total amount of circulating supply held by different cohorts.
The total amount of circulating supply held by long term holders. Long Term Holder Supply 13.85M BTC 0.91% (5D)
The total amount of circulating supply held by short term holders. Short Term Holder Supply 2.94M BTC -2.59% (5D)
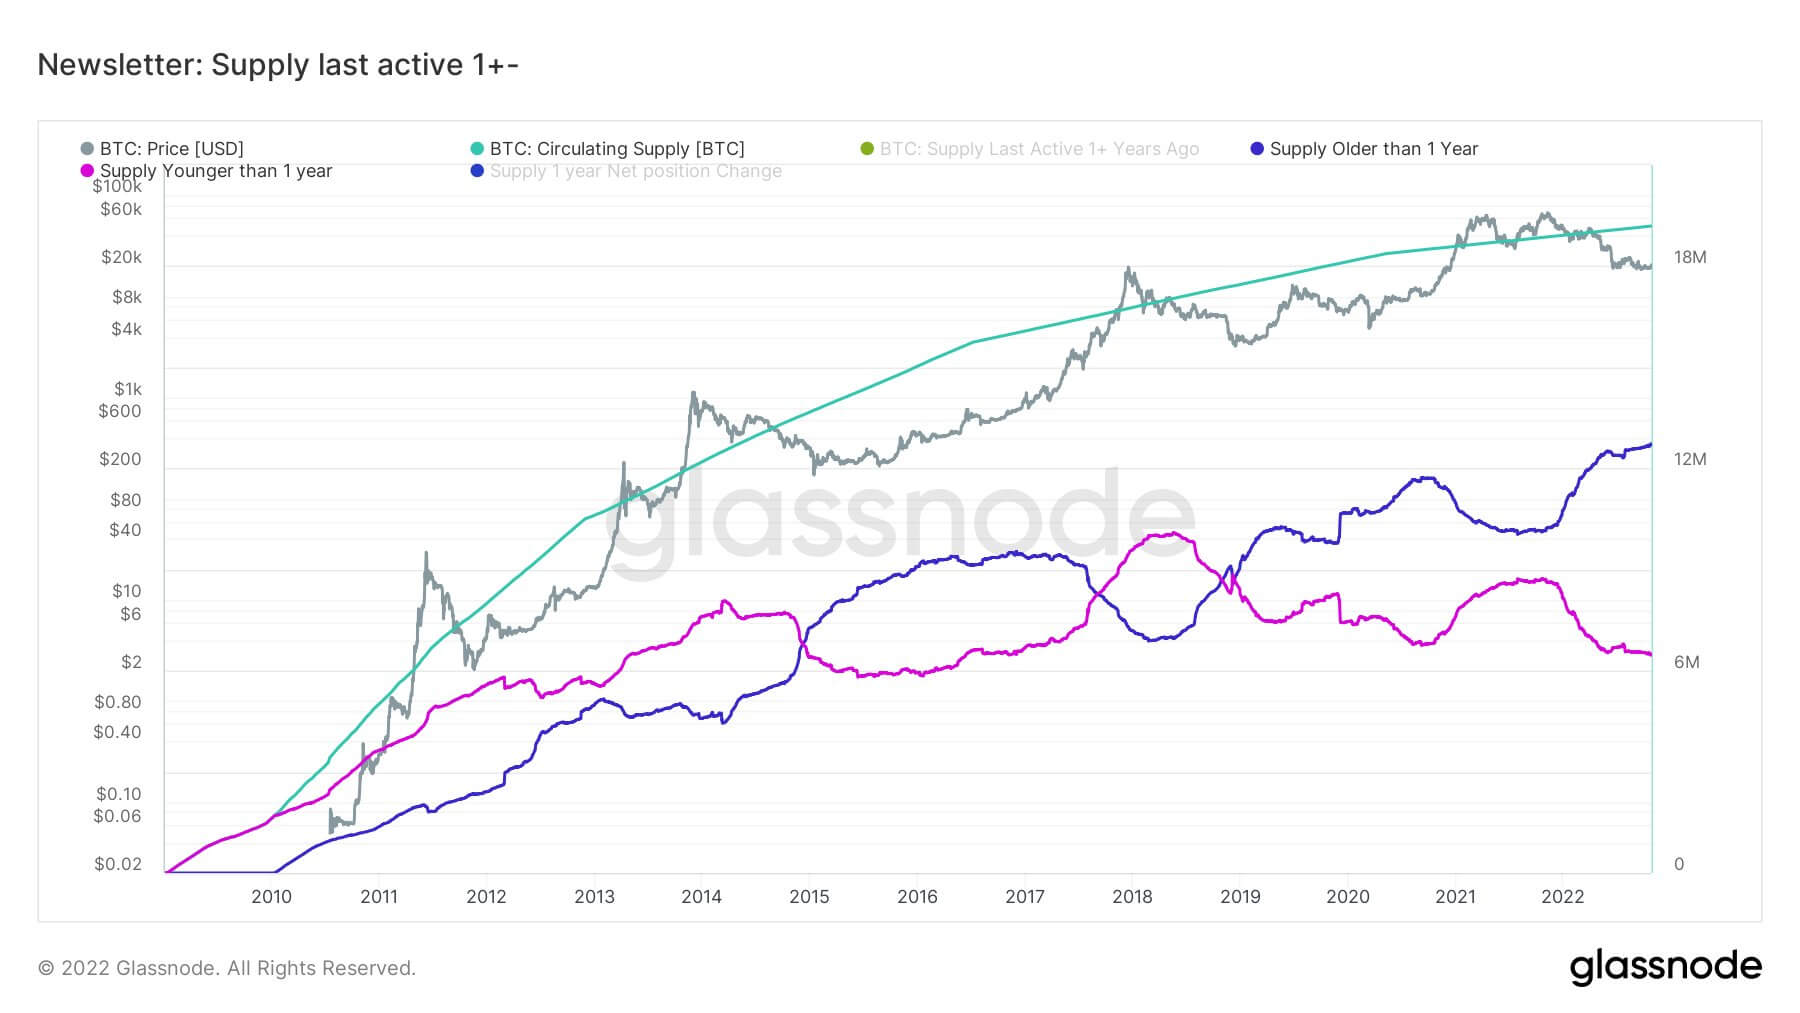
The percent of circulating supply that has not moved in at least 1 year. Supply Last Active 1+ Year Ago 66% 0.61% (5D)
The total supply held by illiquid entities. The liquidity of an entity is defined as the ratio of cumulative outflows and cumulative inflows over the entity’s lifespan. An entity is considered to be illiquid / liquid / highly liquid if its liquidity L is ≲ 0.25 / 0.25 ≲ L ≲ 0.75 / 0.75 ≲ L, respectively. Illiquid Supply 14.85M BTC 0.18% (5D)
The 2021 cycle was different from the 2013 and 2017 cycle
During bear market cycles, long-term holders are the smart money of the Bitcoin ecosystem; they accumulate while Bitcoin is deemed good value. As you can see, during bear markets, long-term holder supply grows while short-term holder supply diminishes as they usually come for number go up technology.
The peak of 2021 was slightly different from the blow-off top of 2013 and 2017, as Bitcoin didn’t get a blow-off top as short-term holder supply didn’t go above long-term holder supply. This could be due to the fed artificially intervening in the market during covid to distort this cycle, and if the fed were to reverse course and start with QE again, we could see a blow-off top. Notice the gap between LTHs and STHs is growing, which occurs in every bear market cycle.
Credit: Source link


")


 Bitcoin
  Ethereum
  Tether
  BNB
BNB  Solana
  USDC
USDC  XRP
XRP  Dogecoin
  Toncoin
  Cardano
  Shiba Inu
  Avalanche
  Wrapped Bitcoin
  Bitcoin Cash
  Polkadot
  Polygon
  NEAR Protocol
  Litecoin
  Uniswap
  LEO Token
  Aptos
Aptos  First Digital USD
  Filecoin
  OKB
OKB  Stellar
  Cosmos Hub
  Render
  Arbitrum
  Bittensor
  Immutable
  Hedera
  dogwifhat
  Maker
Maker  The Graph
  Injective
  Optimism
  Ethena USDe
  Fetch.ai
