
Ripple Price Prediction – December 24
The Ripple price prediction is seen sliding towards the 9-day and 21-day moving averages with 7.32% loses.
XRP/USD Market
Key Levels:
Resistance levels: $1.10, $1.15, $1.20
Support levels: $0.80, $0.75, $0.70
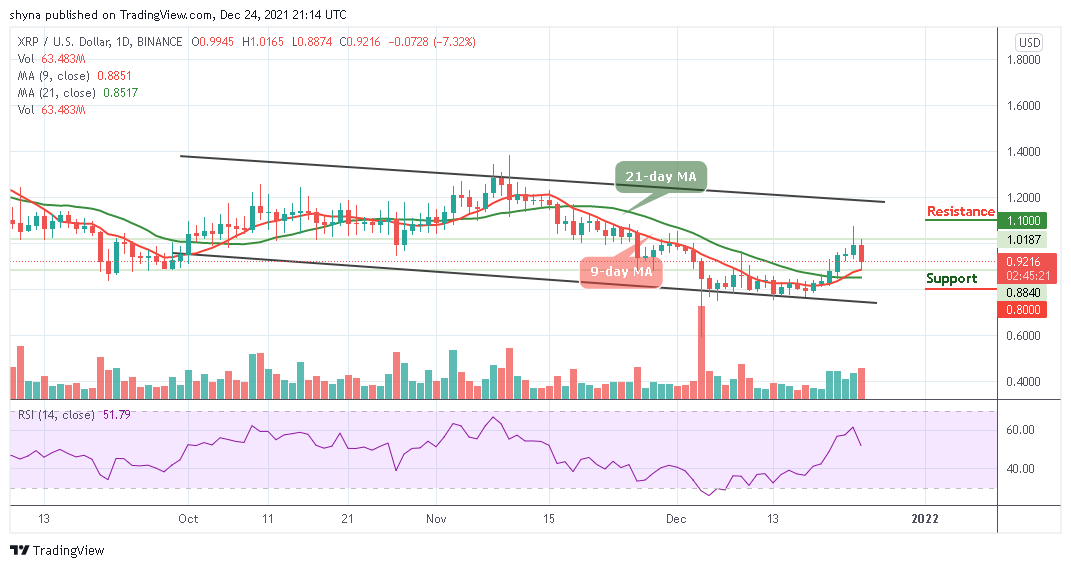
XRPUSD – Daily Chart
XRP/USD is slowly declining below the lower boundary of the channel as the coin prepares to drop below $0.85 support. After struggling to stay above $1.05, the Ripple price is now seen following a slow and steady decline but the 9-day moving average is seen crossing above the 21-day moving average to move into a short-term bullish zone.
Ripple Price Prediction: Ripple (XRP) May Touch More Supports
At the time of writing, the Ripple price is currently exchanging hands at $0.92 after touching the daily low of $0.88 and any attempt to make it cross below the 9-day and 21-day moving averages may likely give room for more downsides and the price could spike below the $0.85 support level. However, traders should wait for a bullish cross back towards the upper boundary of the channel before creating a new bullish trend at the resistance levels of $1.10, $1.15, and $1.20.
In other words, the market may experience a quick buy once the trade reaches the 9-day MA. And if the price fails to rebound, then a bearish breakout is likely to trigger more selling opportunities for traders, which might cause the price to retest $088 and could further drop to $0.80, $0.75, and $0.70 support levels respectively. The technical indicator Relative Strength Index (14) moves below 50-level, suggesting additional bearish signals for the market.

When compares with BTC, the Ripple price is moving sideways as the coin crosses below the 9-day moving average but yet to cross below 21-day moving average. If the selling pressure persists, XRP/BTC may likely create a new low as the technical indicator Relative Strength Index (14) moves below 50-level. In addition, a negative move may come to play in the market as the coin could slide towards the lower boundary of the channel.
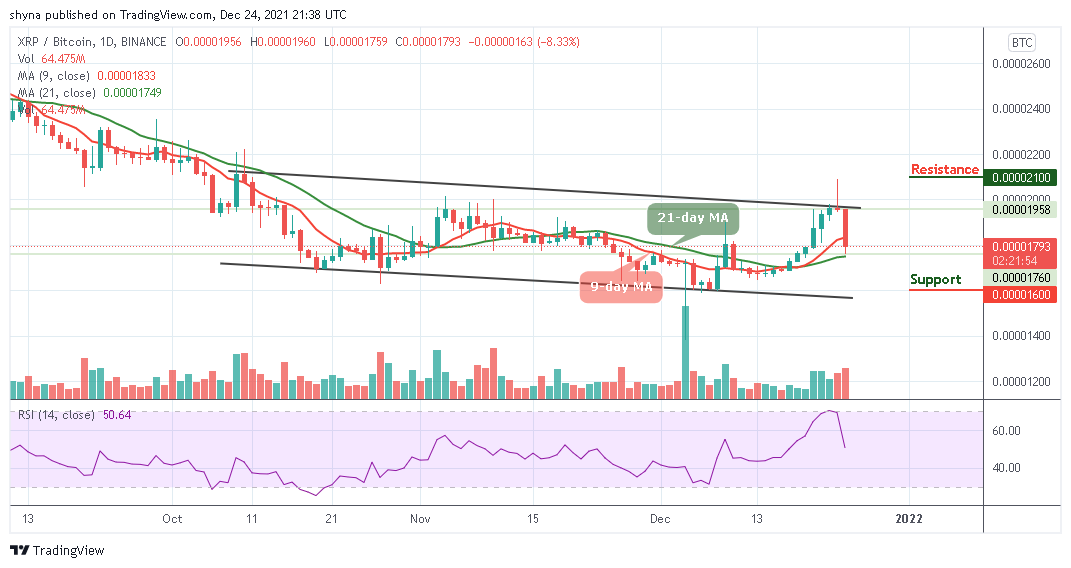
XRPBTC – Daily Chart
However, traders may expect close support at 1700 SAT before breaking to the critical support level of 1600 SAT and below. Meanwhile, if a bullish movement crosses above the upper boundary of the channel; we can then confirm a bullish movement for the market which could locate the resistance level at 2100 SAT and above.
Looking to buy or trade Ripple (XRP) now? Invest at eToro!
68% of retail investor accounts lose money when trading CFDs with this provider
Credit: Source link


")


 Bitcoin
  Ethereum
  Tether
  BNB
BNB  Solana
  USDC
USDC  XRP
XRP  Dogecoin
  Toncoin
  Cardano
  Shiba Inu
  Avalanche
  Wrapped Bitcoin
  Polkadot
  Bitcoin Cash
  NEAR Protocol
  Polygon
  Litecoin
  Uniswap
  LEO Token
  Hedera
  First Digital USD
  Aptos
Aptos  Render
  Stellar
  Filecoin
  Cosmos Hub
  Immutable
  dogwifhat
  OKB
OKB  Bittensor
  Pepe
Pepe  Arbitrum
  XT.com
  Maker
Maker  The Graph
  Optimism
  Fetch.ai
