
Ripple Price Prediction – December 3
The Ripple price prediction shows that XRP is likely to remain below the moving averages as the RSI (14) moves below 40-level.
XRP/USD Market
Key Levels:
Resistance levels: $1.20, $1.30, $1.40
Support levels: $0.75, $0.65, $0.55
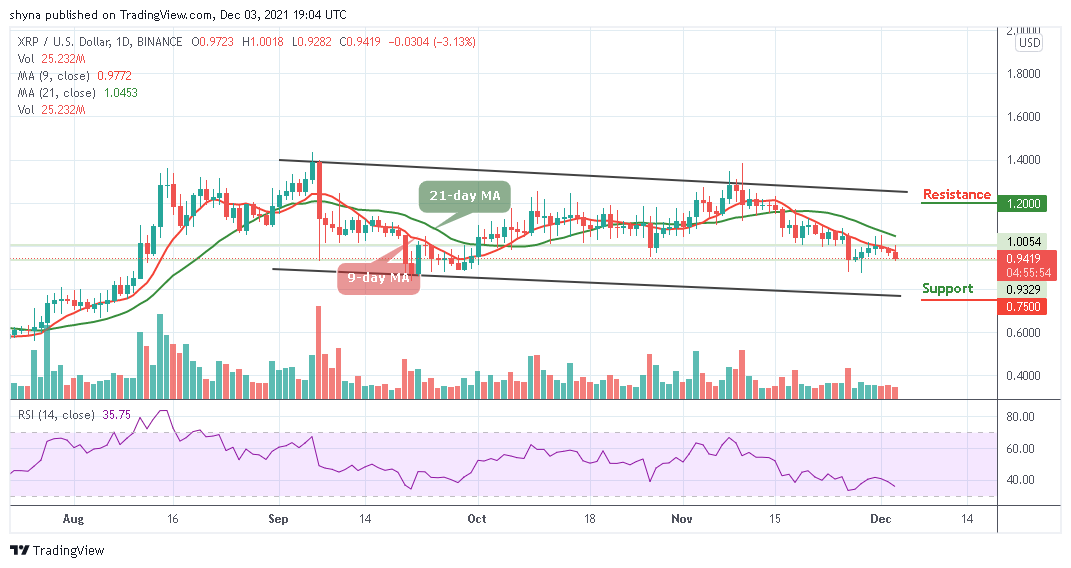
XRP/USD may continue to follow the downward movement by moving slowly below the key supports. At the time of writing, it is likely for the coin to revisit the $0.90 support before it could start a new increase. However, during the European session today, the Ripple price struggles to stay above the 9-day moving average as the coin begins a slow and steady decline to move into a short term bearish zone.
Ripple Price Prediction: Ripple Price May Drop to the Downside
The Ripple price is currently exchanging hands at $0.94 and any attempt to make it fall more may open the doors for more downsides and the price could spike below the $0.85 support level. However, traders should focus on the support level of $0.75 before creating a new bullish trend at the resistance levels of $1.20, $1.30, and $1.40.
Moreover, traders may likely experience a quick buy once the 9-day moving average crosses above 21-day moving average. And if the price fails to rebound, then a bearish breakout is likely to trigger more selling opportunities for traders, which might cause the price to test the nearest support at $0.85 and could further drop to $0.75, $0.65, and $0.55 support levels while the technical support Relative Strength Index (14) moves below 35-level.

When compares with BTC, the Ripple (XRP) is seen following a sideways movement. However, if the selling pressure continues, the Ripple price movement may likely bring a new low into the market. At the moment, the technical indicator Relative Strength Index (14) is moving above 40-level; more negative moves may resurface if the pair crosses below this level.
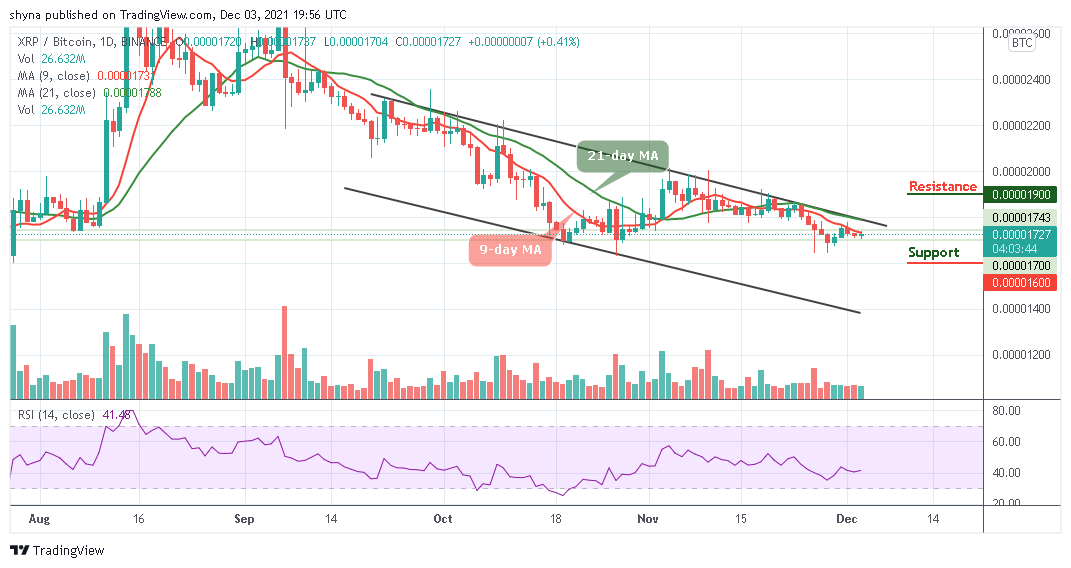
Nevertheless, the sellers could expect the nearest support below the moving averages before breaking to 600 SAT and below. Moreover, if a bullish movement occurs, the buyers may likely push the coin to cross above the upper boundary of the channel, then traders may confirm a bullish movement and the nearest resistance levels lie at 1600 SAT and above.
Looking to buy or trade Ripple (XRP) now? Invest at eToro!
68% of retail investor accounts lose money when trading CFDs with this provider
Credit: Source link


 Sees Zero Inflows, Ending 71-Day Streak")
 on CELO Network")


")


 Bitcoin
  Ethereum
  Tether
  BNB
BNB  Solana
  USDC
USDC  XRP
XRP  Dogecoin
  Toncoin
  Cardano
  Shiba Inu
  Avalanche
  Wrapped Bitcoin
  Bitcoin Cash
  Polkadot
  NEAR Protocol
  Polygon
  Litecoin
  Uniswap
  LEO Token
  First Digital USD
  Hedera
  Aptos
Aptos  Render
  Pepe
Pepe  Stellar
  Filecoin
  Cosmos Hub
  OKB
OKB  dogwifhat
  Immutable
  Bittensor
  XT.com
  Arbitrum
  Maker
Maker  Wrapped eETH
  Optimism
  The Graph
