
Ripple Price Prediction – March 14
The Ripple price prediction continues to battle with the $0.80 level after being supported by the 9-day and 21-day moving averages.
XRP/USD Market
Key Levels:
Resistance levels: $0.95, $1.00, $1.05
Support levels: $0.60, $0.55, $0.50
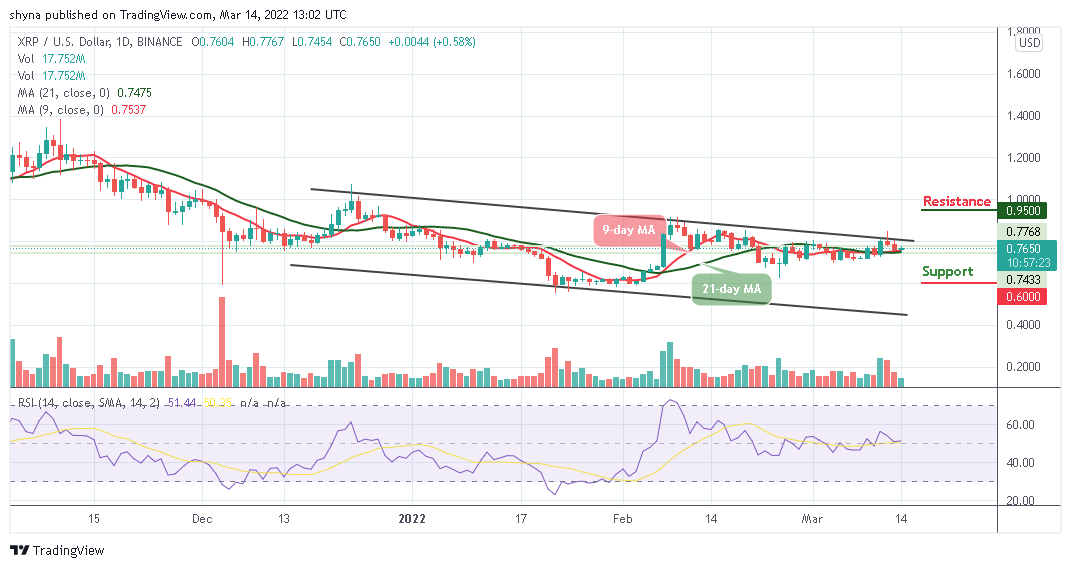
At the time of writing, XRP/USD is seen trading at $0.76 above the 9-day and 21-day moving averages. Since the past few weeks, the Ripple price has been moving sideways as it continues to struggle to cross above the upper boundary of the channel. However, the attempt to push the coin to the upside shows that the bulls are battling to step back into the market.
Ripple Price Prediction: Would Ripple (XRP) Head to the Upside?
According to the daily chart, the Ripple price may cross above the channel to hit the nearest resistance level of $0.80 if the bulls put more pressure. Any additional movement above this barrier could reach the important resistance level at $0.90. If the Ripple price can break above this level, higher resistance could be located at $0.95, $1.00, and $1.05.
Meanwhile, if the price decides to cross below the moving averages, the nearest support to reach is found at the $0.0.75 level. Beneath this, further supports could be located at $0.60, $0.55, and $0.50. However, the technical indicator Relative Strength Index (14) is currently moving above 50-level as traders wait for a bullish crossover to push the market higher. On the contrary, the coin may visit the negative side, if the 9-day MA crosses below the 21-day MA.

Against Bitcoin, the Ripple price moves to cross below the 9-day and 21-day moving averages as the nearest support level lies below the moving averages. However, if the buyers push the Ripple (XRP) above the upper boundary of the channel, the potential resistance level could be located at 2300 SAT and above.

In other words, the market price may cross below the moving averages to give additional bearish signals; therefore, if the coin nosedives toward the lower boundary of the channel, this can lead to the support level of 1700 SAT and below. Meanwhile, the market may head to the downside as the technical indicator Relative Strength Index (14) moves to cross below 50-level.
Looking to buy or trade Ripple (XRP) now? Invest at eToro!
68% of retail investor accounts lose money when trading CFDs with this provider
Credit: Source link


 Profits Expands Portfolio with Two Utility Coins")


 Bitcoin
  Ethereum
  Tether
  BNB
BNB  Solana
  USDC
USDC  XRP
XRP  Dogecoin
  Toncoin
  Cardano
  Shiba Inu
  Avalanche
  Wrapped Bitcoin
  Bitcoin Cash
  Polkadot
  Polygon
  Litecoin
  NEAR Protocol
  Uniswap
  LEO Token
  Aptos
Aptos  First Digital USD
  OKB
OKB  Filecoin
  Stellar
  Cosmos Hub
  Render
  Bittensor
  dogwifhat
  Immutable
  Arbitrum
  Hedera
  Maker
Maker  Injective
  The Graph
  Optimism
  Ethena USDe
  Wrapped eETH
