
XRP Market Strives, Stopping Corrections – February 23
There has been a line of declines in the Ripple XRP/USD trade economy as the market strives, stopping corrections. Price has risen from a low of $0.70 to hit a high of $0.74 during today’s operations at a minute positive percentage of 0.58.
Market Strives, Stopping Corrections: XRP Market
Key Levels:
Resistance levels: $0.80, $0.90, $1.00
Support levels: $0.60, $0.50, $0.40 XRP/USD – Daily Chart
The Ripple XRP/USD daily chart reveals that the crypto-economic market strives, stopping corrections. The February 7th bullish candlestick emerged to propel the crypto-economic market for some ups. But it has almost seen total reversal trading conditions present in an erratic outlook. The 14-day SMA indicator is underneath the 50-day SMA indicator. The Stochastic Oscillators are in the oversold region with their lines closed within.
Can the Ripple XRP/USD trade push northward back as the crypto market strives, stopping corrections?
It somewhat indicated that the Ripple XRP/USD trade can potentially resume; pushing northward back in no time as the crypto market strives, stopping corrections. A slight downward push against the $0.70 level can lead the market back into moving in rages toward its previous support at $0.60 so that buyers may have a rethink to either add to positions.
On the downside of the technical analysis, intensification of selling efforts has to feature below the psychological trading level of $0.80 if the Ripple XRP/USD market short-position placers will have to dominate the trend. To that end, some less volatile pull-ups have to emerge around the value-line purposely to encounter resistance that will, in return, give in back to a falling force. And, exertion of sell order has to follow to avoid late entry.
.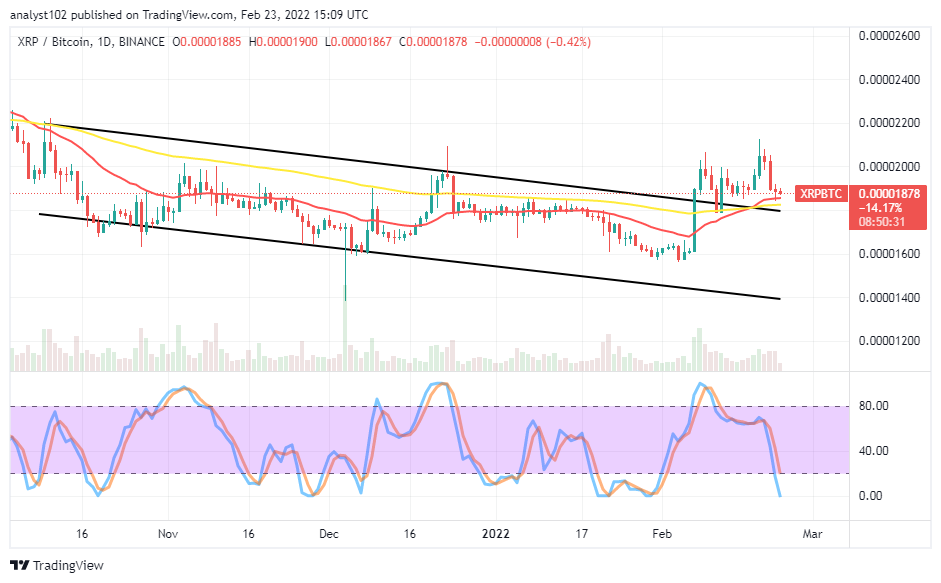
XRP/BTC Price Analysis
In comparison, Ripple XRP pairing against Bitcoin appears holding a downing motion above the buy signal side of the SMAs. The signal on the price analysis chart has seemingly not suggested that the cryptocurrency pair market strives to stop corrections. The 14-day SMA has briefly intercepted the 50-day SMA to the upside as a bearish candlestick is forming to average the smaller-trading indicator from the top. The Stochastic Oscillators are in the oversold region, pointing to the southbound to signify the base crypto may still have to go a bit down for the counter crypto for a while.
Looking to buy or trade Bitcoin (BTC) now? Invest at eToro!

68% of retail investor accounts lose money when trading CFDs with this provider.
Read more:
Credit: Source link


")


 Bitcoin
  Ethereum
  Tether
  BNB
BNB  Solana
  USDC
USDC  XRP
XRP  Toncoin
  Dogecoin
  Cardano
  Avalanche
  Shiba Inu
  Wrapped Bitcoin
  Bitcoin Cash
  Polkadot
  Polygon
  NEAR Protocol
  Litecoin
  Uniswap
  LEO Token
  Aptos
Aptos  First Digital USD
  OKB
OKB  Filecoin
  Cosmos Hub
  Stellar
  Bittensor
  Arbitrum
  Render
  Immutable
  Hedera
  Maker
Maker  dogwifhat
  Injective
  The Graph
  Ethena USDe
  Optimism
  Wrapped eETH
