
XRP Valuation Declines, Averaging $0.80 – December 29
It has now experienced that the Ripple XRP/USD valuation declines, averaging $0.80 as the crypto economy trades between the high and low of $0.86 and %0.81 value lines. The market’s percentage rate is at 1.34 negatives as of writing.
XRP Valuation Declines, Averaging $0.80: XRP Market
Key Levels:
Resistance levels: $).90, $1.00, $1.10
Support levels: $0.70, $0.60, $0.50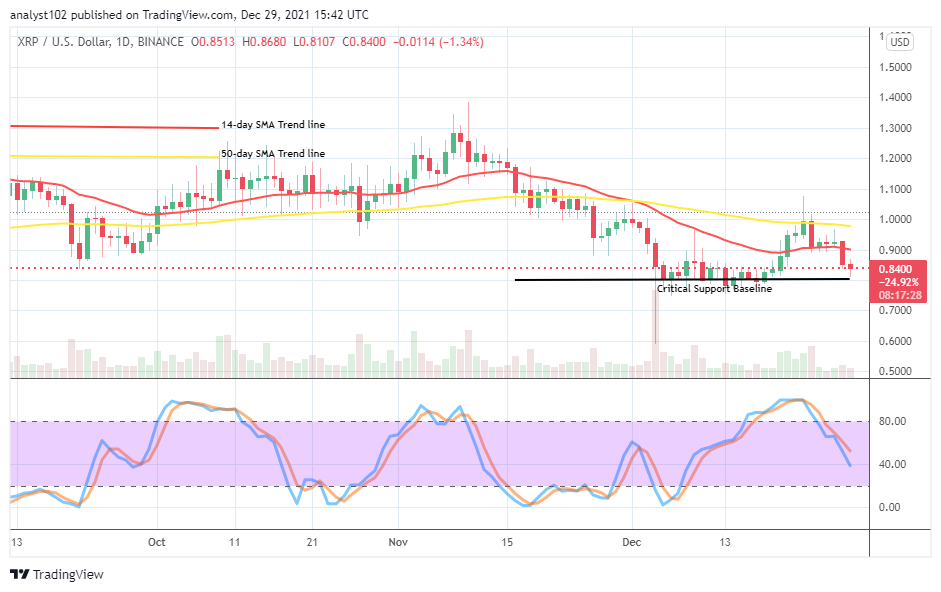 XRP/USD – Daily Chart
The Ripple XRP/USD daily chart shows that the crypto-economic valuation declines, averaging $0.80, believed to be a critical support baseline. The 14-day SMA trend line is underneath the 50-day SMA trend line. The Stochastic oscillators have crossed southbound from the overbought region to touch the range of 40. That signifies that the crypto coin is under falling forces as traded against the US Dollars’ worth.
Will the Ripple XRP/USD market go under further to re-set a lower support baseline as the crypto-economic valuation declines, averaging $0.80?
The extent that the Ripple XRP/USD market may go under furthermore is in the womb of time while the bulls will fully back into action as the crypto-economic valuation declines, averaging $0.80. The breaking of the value line sustainably will allow the market to find and build a new support baseline around $0.70. However, a bounce-off is to play out in no time to put the market back on track with the mooning trend.
On the downside of the Ripple XRP/USD market technical analysis, the positioning of the 14-day SMA indicator at $0.90 signifies that the crypto economy may continue trading below that resistance level for some time. But, a sudden aggressive rebounding against the point will allow the crypto to regain the market’s control against bearish forces in the long-term run outlook.
.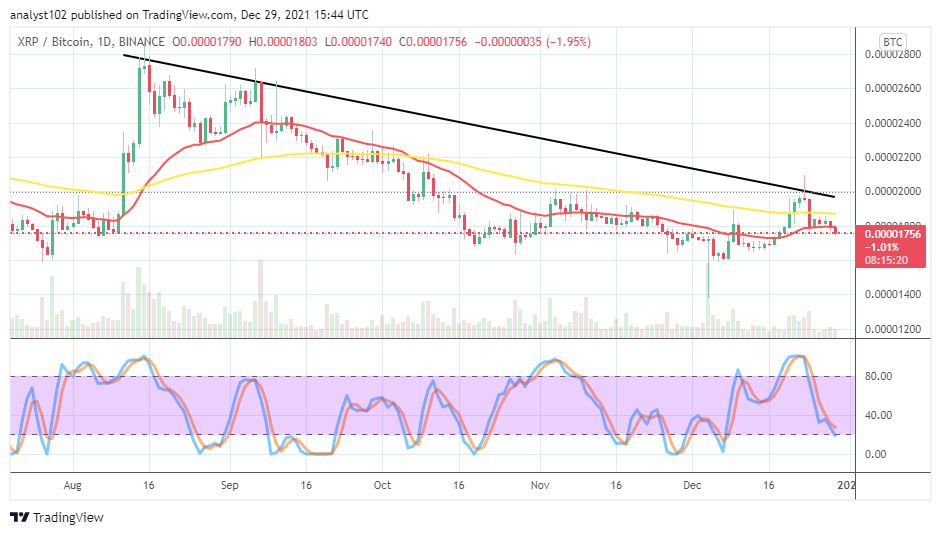
XRP/BTC Price Analysis
In comparison, Ripple XRP still lacks the catalyst to push against Bitcoin until the present. The Ripple XRP/USD price analysis chart showcases that the cryptocurrency pair valuation declines underneath the SMAs’ trend lines. The 50-day SMA indicator is above the 14-day SMA indicator. The Stochastic Oscillators have moved close to the range of 20. A smaller bearish candlestick is in the making to indicate that the base crypto is losing its stances to the counter crypto. Traders may have to wait for a bullish candlestick to emerge against some of the bearish candlesticks been forming penultimately to give an upward motion returning confirmation.
Looking to buy or trade Bitcoin (BTC) now? Invest at eToro!
68% of retail investor accounts lose money when trading CFDs with this provider.

Read more:
Credit: Source link


")


 Bitcoin
  Ethereum
  Tether
  BNB
BNB  Solana
  USDC
USDC  XRP
XRP  Dogecoin
  Toncoin
  Cardano
  Shiba Inu
  Avalanche
  Wrapped Bitcoin
  Bitcoin Cash
  Polkadot
  NEAR Protocol
  Polygon
  Litecoin
  Uniswap
  LEO Token
  Aptos
Aptos  First Digital USD
  Filecoin
  Render
  Immutable
  Cosmos Hub
  Bittensor
  Stellar
  OKB
OKB  Hedera
  Arbitrum
  The Graph
  Pepe
Pepe  dogwifhat
  Maker
Maker  Optimism
  Injective
  Fetch.ai
