
Join Our Telegram channel to stay up to date on breaking news coverage
The 1inch price prediction may likely set a bullish run if the market can climb back above the $3000 resistance level.
1inch Prediction Statistics Data:
- 1inch price now – $0.37
- 1inch market cap – $353.4 million
- 1inch circulating supply – 949.8 million
- 1inch total supply – 1.5 billion
- 1inch Coinmarketcap ranking – #93
1INCH/USD Market
Key Levels:
Resistance levels: $0.45, $0.50, $0.55
Support levels: $0.25, $0.20, $0.15
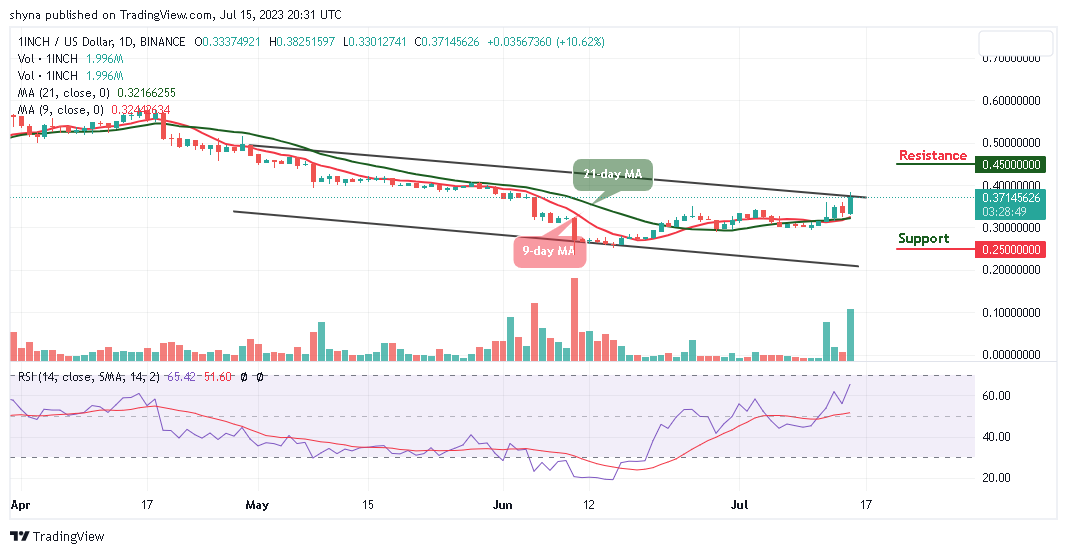
1INCH/USD is trading within a positive movement at the time of writing. The market is running a little retracement move towards $0.36 resistance with price growth of 10.62%. However, 1inch (1INCH) is beginning to maintain a bullish movement within the channel and traders can expect the price to continue to rise as soon as the bulls put more pressure on the market.
1inch Price Prediction: Would 1INCH Price Break Higher?
The 1inch price is likely to break higher again if the coin spikes above the upper boundary of the channel. However, if the price keeps respecting the upward movement, traders can then expect a bullish continuation. As the technical indicator, Relative Strength Index (14) moves to break into the overbought region, the next resistance levels could be located at $0.45, $0.50, and $0.55 respectively.
On the contrary, a bearish break below the 9-day moving average could play out for this market if the bears step into the market. A bearish extension could roll the coin back to the long-term support levels at $0.25, $0.20, and $0.15. Therefore, a continuous fall might further lead to a violent break below $0.10.
When compares with Bitcoin, buyers are stepping back into the market while the 1incoin price is showing some promising signs that could make higher highs above the upper boundary of the channel. From the upside, the nearest resistance level lies at 1300 SAT, and the higher resistance lies at 1400 SAT and above.
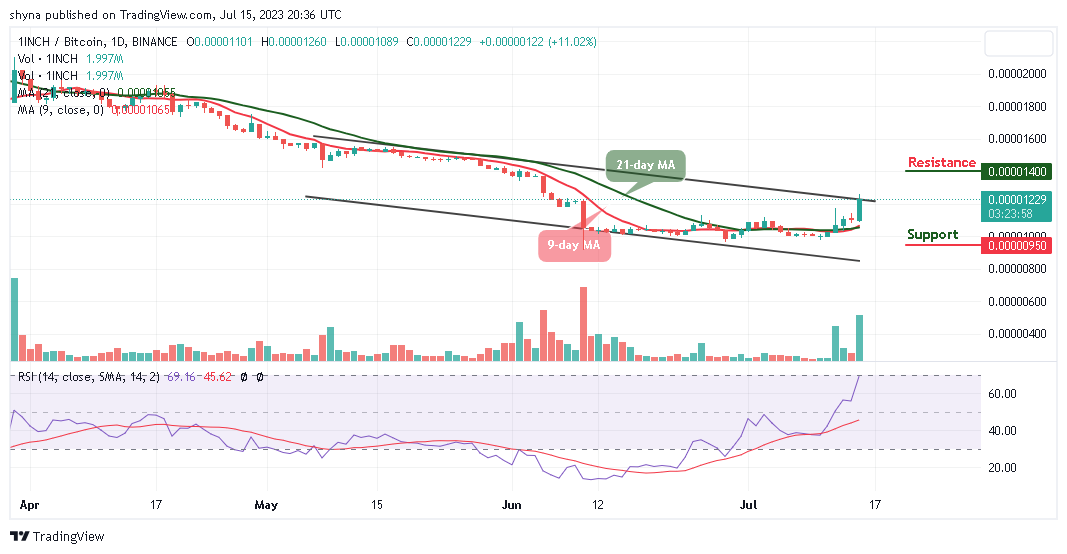
Meanwhile, from the downside, the nearest support level is located at 1000 SAT, if the price drop to create a new low, lower support could be located at 950 SAT and below. Meanwhile, the technical indicator Relative Strength Index (14) is facing the north to cross into the overbought region which shows that the bulls are coming into focus.
Alternatives to 1inch
At the moment, the 1Inch price is moving to break higher highs as the technical indicator Relative Strength Index (14) moves into the overbought region. However, the market is projecting a volatile movement where it could follow the bullish movement.
On that note, the $WSM token was launched to tokenize this movement, fuelling a deeper level of engagement within the community. However, Wall Street Memes’ team has made a bold move in structuring its tokenomics. Unlike many other meme coin projects, the team has decided not to set aside any $WSM tokens for themselves as close to $16m has been raised in the ongoing presale.
Wall Street Memes – Next Big Crypto

- Early Access Presale Live Now
- Established Community of Stocks & Crypto Traders
- Featured on BeInCrypto, Bitcoinist, Yahoo Finance
- Rated Best Crypto to Buy Now In Meme Coin Sector
- Team Behind OpenSea NFT Collection – Wall St Bulls
- Tweets Replied to by Elon Musk
Join Our Telegram channel to stay up to date on breaking news coverage
Credit: Source link


")


")


 Bitcoin
  Ethereum
  Tether
  BNB
BNB  Solana
  USDC
USDC  XRP
XRP  Dogecoin
  Toncoin
  Cardano
  Shiba Inu
  Avalanche
  Wrapped Bitcoin
  Bitcoin Cash
  Polkadot
  NEAR Protocol
  Polygon
  Litecoin
  Uniswap
  LEO Token
  First Digital USD
  Aptos
Aptos  Hedera
  Stellar
  Filecoin
  Cosmos Hub
  OKB
OKB  Pepe
Pepe  XT.com
  Immutable
  Render
  Arbitrum
  Wrapped eETH
  Optimism
  Bittensor
  dogwifhat
  Maker
Maker  The Graph
