
A supply shock may be brewing in Bitcoin as on-chain data shows 57% of all BTC hasn’t seen any movement since at least two years ago.
Bitcoin Supply Dormant Since 2+ Years Has Been Setting New All-Time Highs
As pointed out by Capriole Investments founder Charles Edwards in a post on X, the BTC supply, dormant since at least two years ago, has been hitting consecutive new all-time highs (ATHs) recently.
The Bitcoin investors holding supply this old makeup for a segment of the wider “long-term holder” (LTH) group. The LTHs refer to the investors who have been holding their coins since at least 155 days ago.
A statistical fact is that the longer holders keep their coins still on the blockchain, the less likely they become to move them at any point. Because of this reason, the LTHs are considered the more stubborn side of the BTC market.
The 2+ years segment would then include the investors who would be the most stalwart of diamond hands even among these HODLers, as their holding time is significantly greater than just 155 days.
Now, here is a chart that shows the trend in the percentage of the total circulating Bitcoin supply held by this segment of the LTHs over the history of the cryptocurrency:
The value of the metric seems to have been going up in recent days | Source: @caprioleio on X
As displayed in the above graph, the supply held by these LTHs has been following an upward trajectory since the FTX collapse and has been continuously setting new ATHs.
Recently, the growth in the metric has slowed a bit, but it has still been going up. At present, around 57% of the Bitcoin supply is locked in the hands of these HODLers.
Edwards notes that this is creating a massive supply squeeze for the cryptocurrency. The quant has also pointed out that a similar trend has been seen in the leadup to all past bull runs (marked with the green lines in the chart).
Earlier today, the US SEC finally approved the Bitcoin spot ETFs. Edwards has explained that this could lead toward the supply shock only growing deeper since “the ETFs were only approved for CASH subscriptions (not in-kind). So every purchase takes more Bitcoin off the market.”
A chart analyst, James V. Straten, shared that could also provide another angle at a supply shock brewing in the asset.
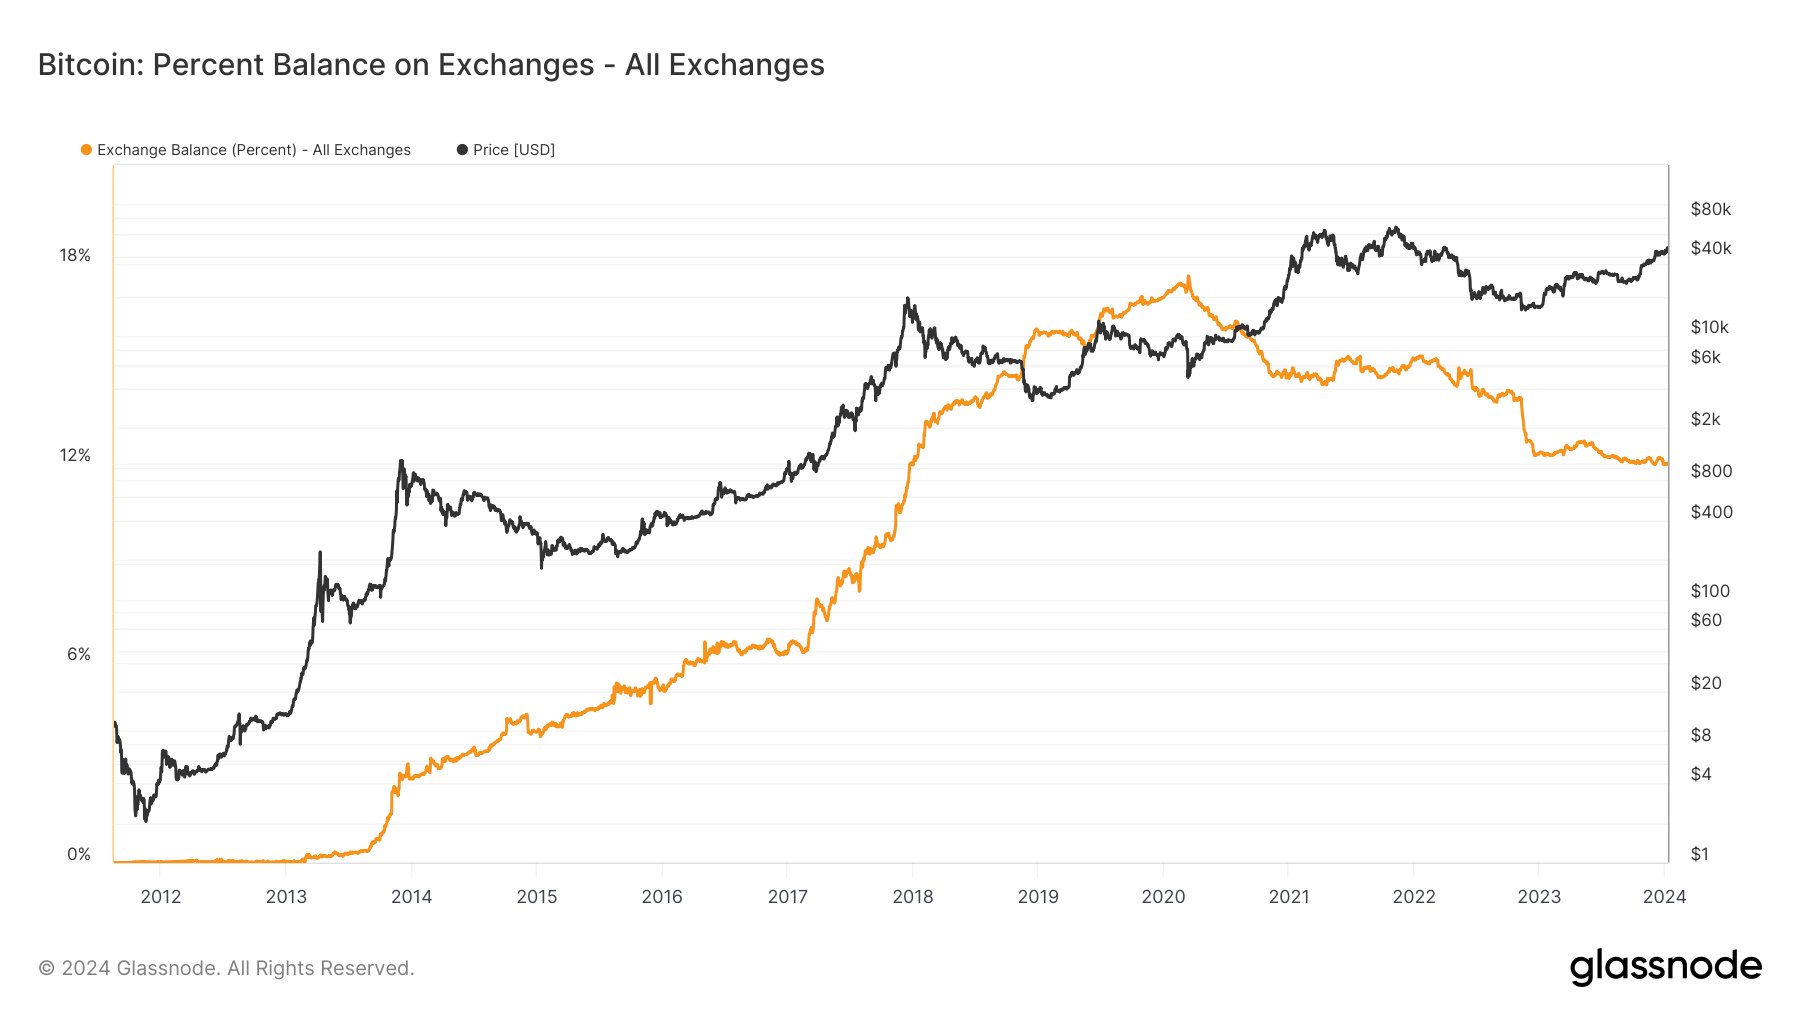
Looks like the metric's value has been going down since a while now | Source: @jimmyvs24 on X
The above graph shows the data for the percentage of the Bitcoin supply sitting in the centralized exchanges’ wallets. This metric has been going down over the last few days, and now, just 12% of all BTC is being stored on these platforms.
The exchange supply is significantly more likely to be involved in buying and selling activities (since that’s what these platforms are for, naturally), so going down means the effective trading supply of the asset is also decreasing.
BTC Price
At the time of writing, Bitcoin is trading at around $45,900, up more than 4% over the last week.
The price of the coin has gone through a rollercoaster in the past day | Source: BTCUSD on TradingView
Featured image from Kanchanara on Unsplash.com, charts from TradingView.com, Glassnode.com
Credit: Source link


 Bitcoin
  Ethereum
  Tether
  BNB
BNB  Solana
  USDC
USDC  XRP
XRP  Dogecoin
  Toncoin
  Cardano
  Shiba Inu
  Avalanche
  Wrapped Bitcoin
  Bitcoin Cash
  Polkadot
  NEAR Protocol
  Polygon
  Litecoin
  Uniswap
  LEO Token
  First Digital USD
  Aptos
Aptos  Hedera
  Stellar
  Filecoin
  Cosmos Hub
  Render
  OKB
OKB  Pepe
Pepe  Immutable
  XT.com
  Arbitrum
  Bittensor
  Maker
Maker  Optimism
  dogwifhat
  Wrapped eETH
  The Graph
