
Understanding the intricacies of Bitcoin balances on crypto exchanges is an integral part of analyzing the market. These balances, marked by inflows and outflows, barometer the market’s health, sentiment, and potential future movements. As these balances shift, they paint a picture of investor behavior, confidence, and strategy. Similarly, volume changes offer insights into the market’s liquidity and trading activity.
Analyzing September’s exchange deposit and withdrawal volumes reveals a consistent pattern of Bitcoin withdrawals surpassing deposits. This isn’t a fleeting trend either—since the beginning of 2023, withdrawals have been outpacing deposits, suggesting a broader market narrative.
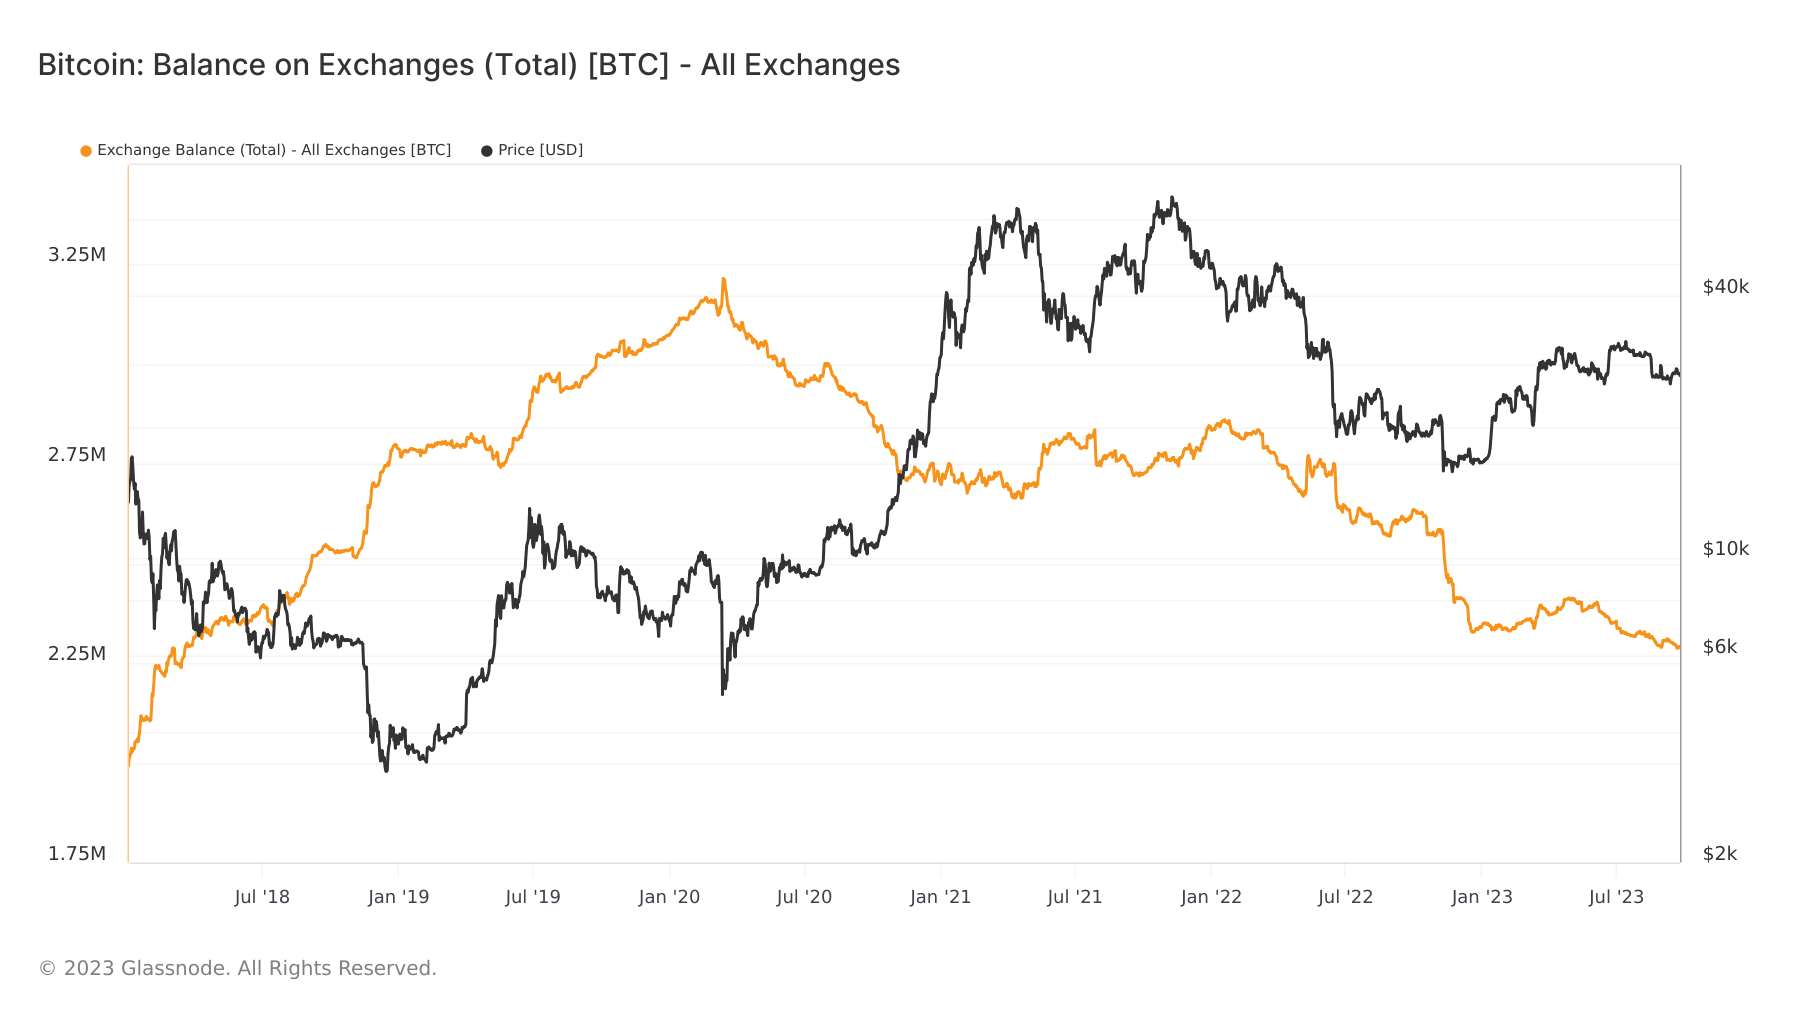
The continually decreasing Bitcoin balance on exchanges further confirms this trend. Exchange balances peaked in March 2020 at 3.21 million BTC. However, the subsequent months and years have seen this number decrease drastically, standing at 2.29 million BTC on Sept. 25, 2023. Despite intermittent periods of positive exchange inflows, the overarching trend has been a decrease.
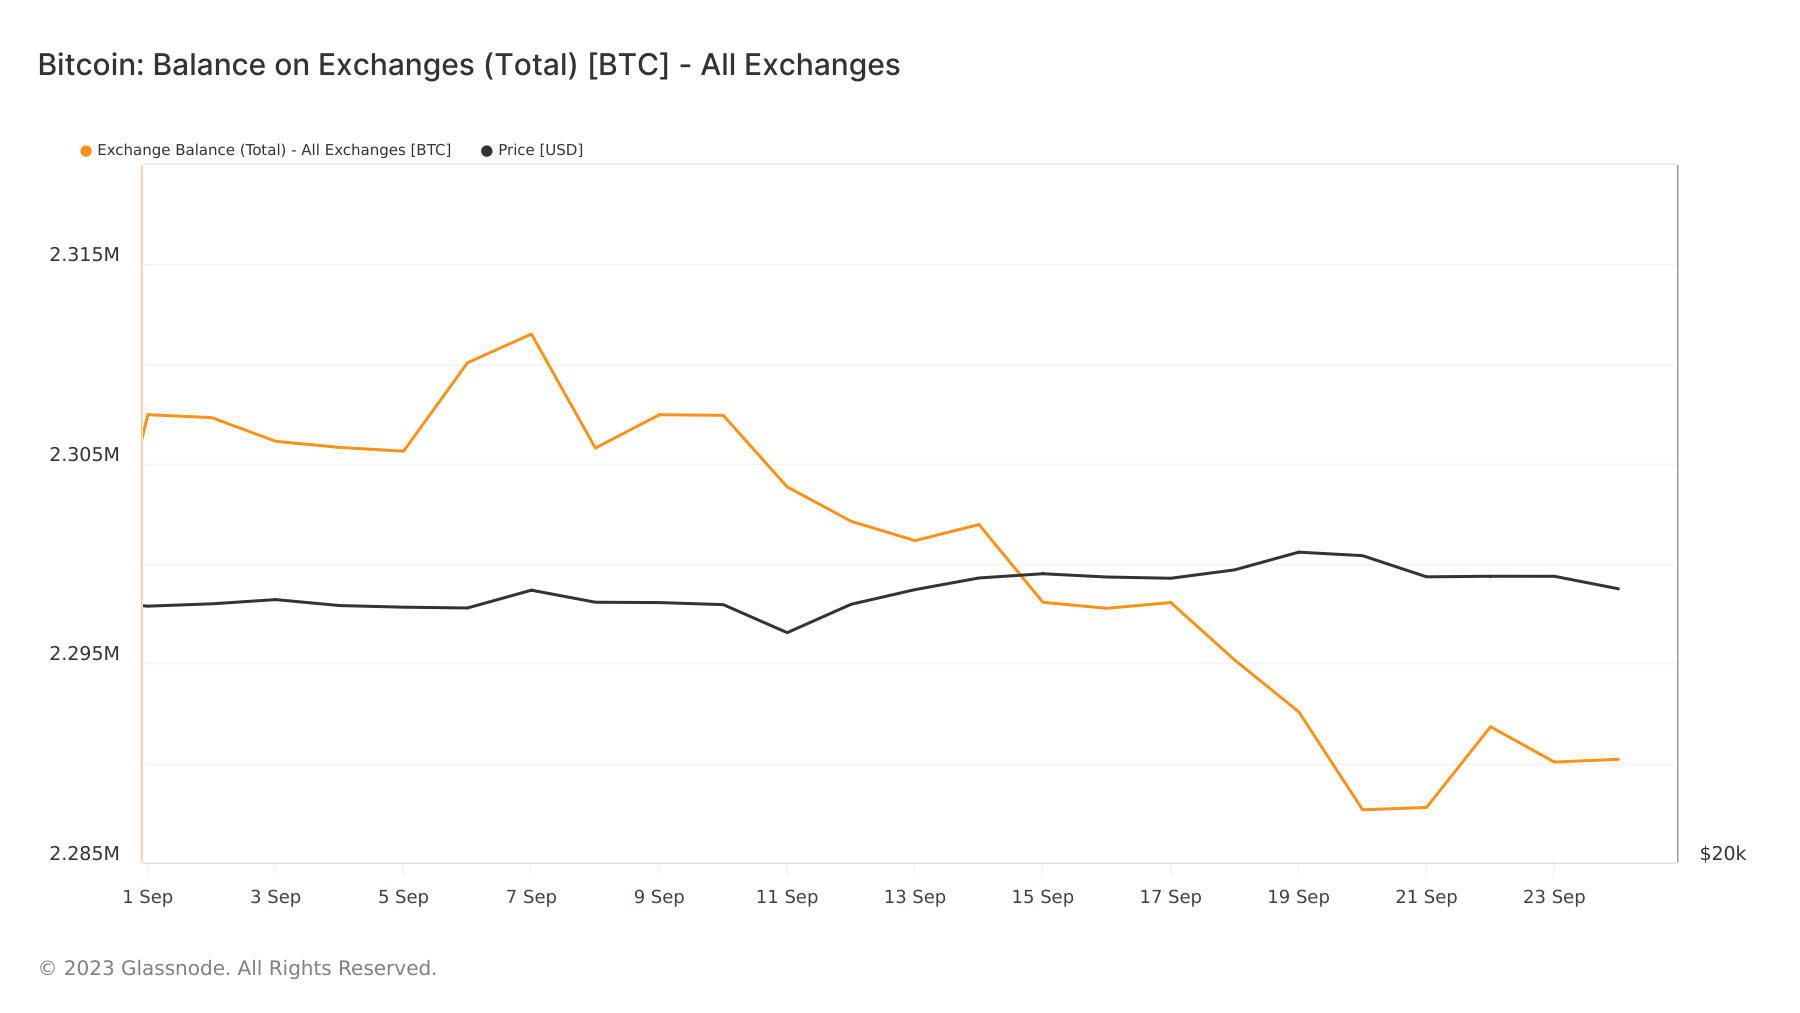
Since the start of September alone, exchanges have seen a reduction of over 17,000 BTC in their Bitcoin balances.
The dominance of withdrawals over deposits could signify a market pivot towards a long-term holding strategy, occurring due to either an anticipatory strategy for future gains or as a protective measure against market volatility.
The exchange volume momentum further confirms this trend. This metric, which juxtaposes the monthly average of combined inflows and outflows against the yearly average, is a reliable indicator of investor interest in Bitcoin. A monthly average surpassing the annual average typically signals an uptick in exchange-related on-chain activity, often accompanying price surges.
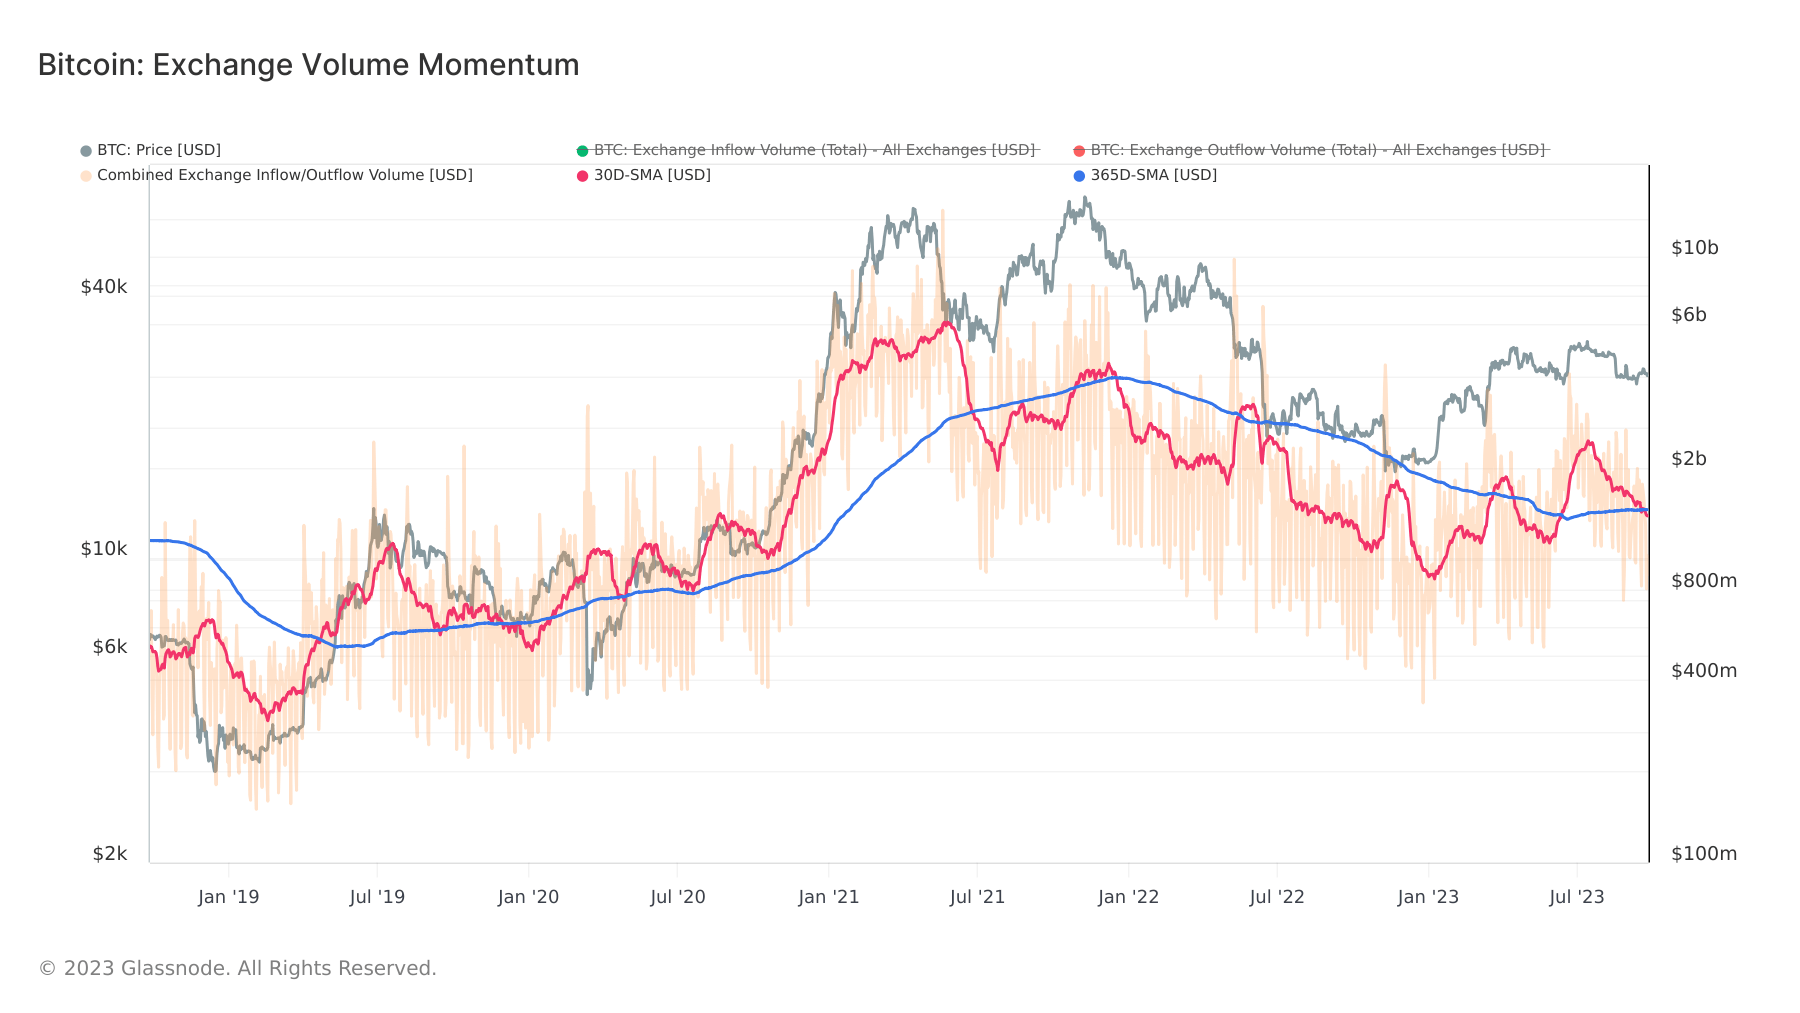
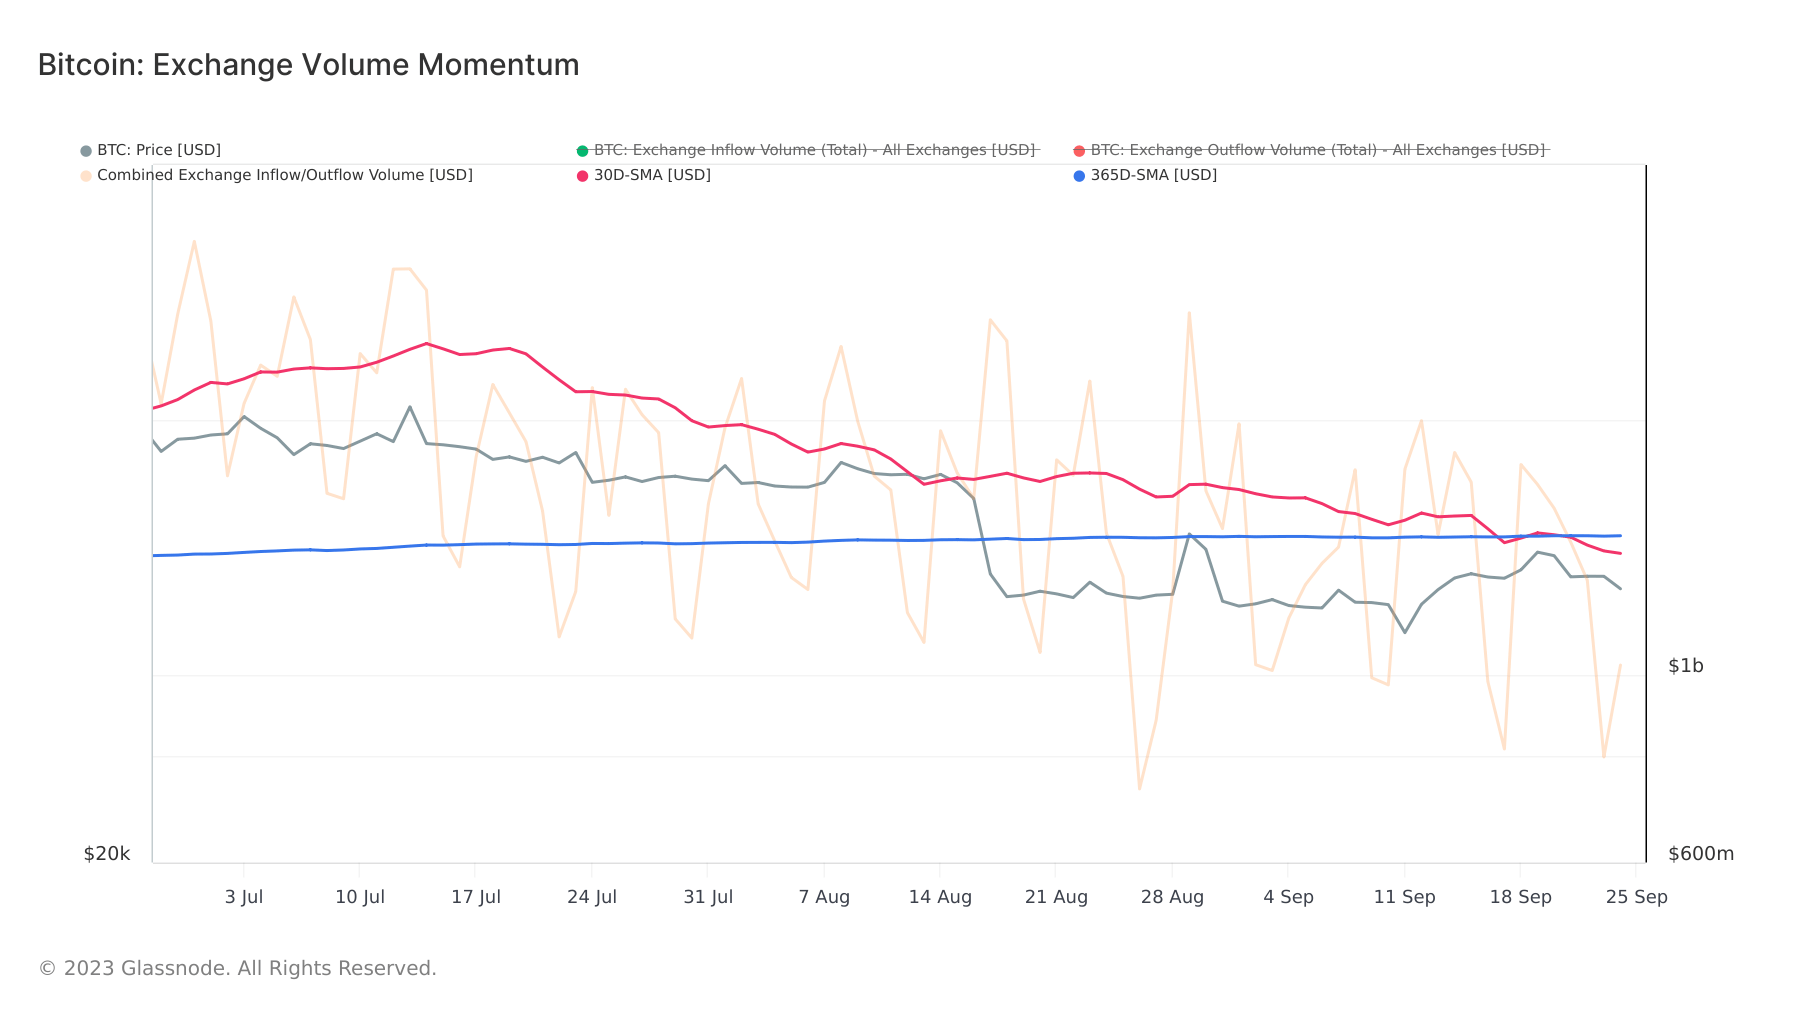
Conversely, when the monthly average lags behind the yearly average, it suggests a contraction in exchange-related on-chain activity. This contraction is symptomatic of waning interest in the asset and a decline in trading volumes. According to Glassnode, the monthly average has been downward since July, culminating in falling below the yearly average on Sep. 21. This decline correlated with Bitcoin’s price dip from $27,225 to $26,220.
The dominance of withdrawals and the declining exchange volume momentum point to a market that’s becoming more conservative. Investors seem to be shifting from a trading mindset to a holding one, possibly anticipating future gains or simply hedging against uncertainty. The recent dip in Bitcoin’s price, coupled with the drop in the monthly average, highlights the potential impact these metrics can have on market movements.
The post A cautious Bitcoin market is shifting from trading to holding appeared first on CryptoSlate.
Credit: Source link


 Bitcoin
  Ethereum
  Tether
  BNB
BNB  Solana
  USDC
USDC  XRP
XRP  Dogecoin
  Toncoin
  Cardano
  Shiba Inu
  Avalanche
  Polkadot
  Wrapped Bitcoin
  Bitcoin Cash
  NEAR Protocol
  Polygon
  Litecoin
  Uniswap
  LEO Token
  Fetch.ai
  Render
  First Digital USD
  Hedera
  Aptos
Aptos  Cosmos Hub
  Pepe
Pepe  Filecoin
  Stellar
  Wrapped eETH
  OKB
OKB  Immutable
  dogwifhat
  Arbitrum
  Optimism
  Bittensor
  The Graph
  Maker
Maker 
