Join Our Telegram channel to stay up to date on breaking news coverage
The Balancer price prediction shows that BAL is likely to cross above the 9-day and 21-day moving averages as the coin hits $3.42 resistance.
Balancer Prediction Statistics Data:
- Balancer price now – $3.40
- Balancer market cap – $176.9 million
- Balancer circulating supply – 52 million
- Balancer total supply – 59 million
- Balancer Coinmarketcap ranking – #140
BAL/USD Market
Key Levels:
Resistance levels: $4.00, $4.20, $4.40
Support levels: $2.80, $2.60, $2.40
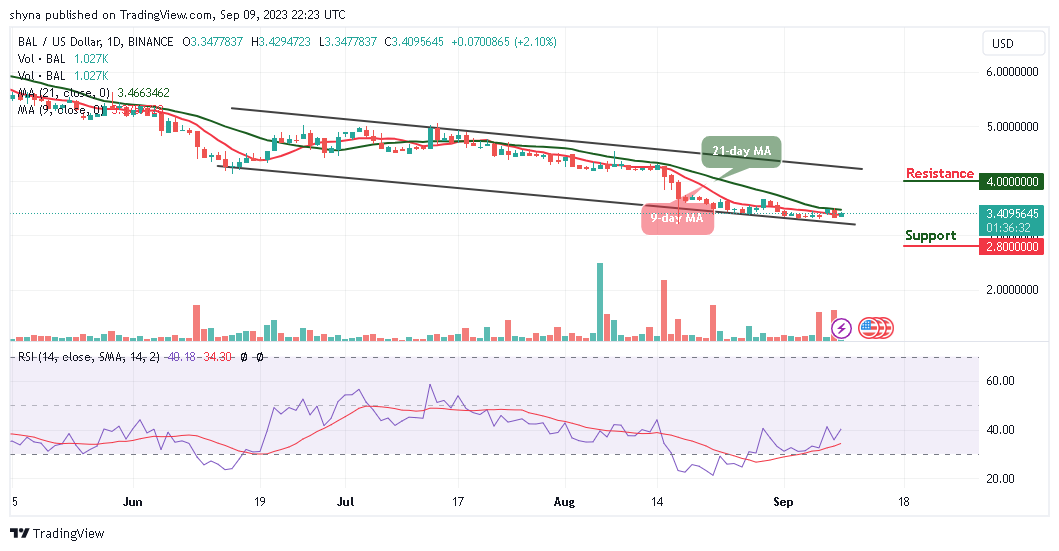
BAL/USD is in the hands of the bulls as the coin moves to cross above the 9-day and 21-day moving averages. Meanwhile, due to a lack of buying power, the bulls may need to gather enough energy to push the coin to the upside. The technical indicator Relative Strength Index (14) is crossing above the 40-level with the signal line pointing to the north, suggesting bullish movement.
Balancer Price Prediction: Balancer (BAL) Gets Ready for the Upside
According to the daily chart, the Balancer price is ready to break into the upside as the coin moves to cross above the 9-day and 21-day moving averages. However, the more the bulls pressurized the bears, the higher the coin would reach. Therefore, if the bulls maintain the upward trend, BAL/USD may continue with the bullish movement which could take the coin to the resistance levels of $4.00, $4.20, and $4.40 respectively.
On the contrary, any strong selling pressure could drag the price below the lower boundary of the channel, and should BTC trade below the daily opening price of $3.34, a bearish movement could take the price to the support levels at $2.80, $2.60, and $2.40.
BAL/BTC May Face the North
Against Bitcoin, the Balancer (BAL) is above the 9-day moving average as the bulls increase their entries within the market. At the time of writing, the Balancer price has not been able to push the price above the upper boundary of the channel but it is currently trading around 1318 SAT. Therefore, if the coin signals a bullish rally, it could meet the resistance at 1500 SAT and above.
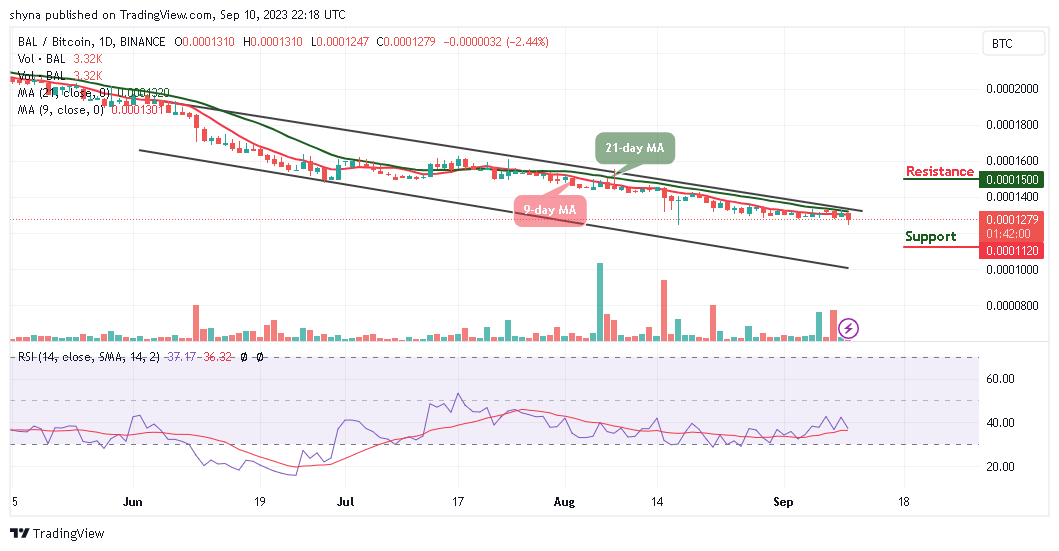
Looking at the daily chart, traders can see that the market may follow the bullish movement as the technical indicator Relative Strength Index (14) moves above the 40-level. However, any bearish movement below the moving averages could hit the support at 1120 SAT and below.
Alternatives to Balancer
The Balancer price is likely to cross above the 9-day and 21-day moving averages to increase the bullish movement. However, the coin might kick-start another bullish run above $3.50 resistance if the buyers increase the pressure. Therefore, any positive break above the 21-day MA is the first signal needed for the buyers to press higher.
Meanwhile, the central differentiator that separates Wall Street Memes from other meme coins lies in its core mission, that is, to disrupt the established financial order and empower the common investor. Thus far, the token has raised an impressive sum of over $25 million during its presale period, eagerly anticipating its official launch just around the corner. For prospective investors, the optimal window to invest is at this moment, not later.
Wall Street Memes – Next Big Crypto

- Early Access Presale Live Now
- Established Community of Stocks & Crypto Traders
- Featured on BeInCrypto, Bitcoinist, Yahoo Finance
- Rated Best Crypto to Buy Now In Meme Coin Sector
- Team Behind OpenSea NFT Collection – Wall St Bulls
- Tweets Replied to by Elon Musk
Join Our Telegram channel to stay up to date on breaking news coverage
Credit: Source link


 Now Listed on Bitget in the Innovation, GameFi and AI Zone")


 Do the Risks Outweigh the Rewards Wednesday? – InvestorsObserver")


 Bitcoin
  Ethereum
  Tether
  BNB
BNB  Solana
  USDC
USDC  XRP
XRP  Dogecoin
  Toncoin
  Cardano
  Shiba Inu
  Avalanche
  Wrapped Bitcoin
  Bitcoin Cash
  Polkadot
  NEAR Protocol
  Polygon
  Litecoin
  Uniswap
  LEO Token
  First Digital USD
  Hedera
  Aptos
Aptos  Stellar
  Cosmos Hub
  Filecoin
  OKB
OKB  Render
  Immutable
  XT.com
  Pepe
Pepe  Arbitrum
  Bittensor
  Maker
Maker  dogwifhat
  Optimism
  Wrapped eETH
  The Graph
