
Join Our Telegram channel to stay up to date on breaking news coverage
The Band Protocol price prediction shows that BAND may slide above the upper boundary of the channel to continue the upward trend.
Band Protocol Prediction Statistics Data:
- Band Protocol price now – $1.33
- Band Protocol market cap – $167.9 million
- Band Protocol circulating supply – 127.7 million
- Band Protocol total supply – 136.5 million
- Band Protocol Coinmarketcap ranking – #153
BAND/USD Market
Key Levels:
Resistance levels: $1.70, $1.80, $1.90
Support levels: $1.00, $0.90, $0.80
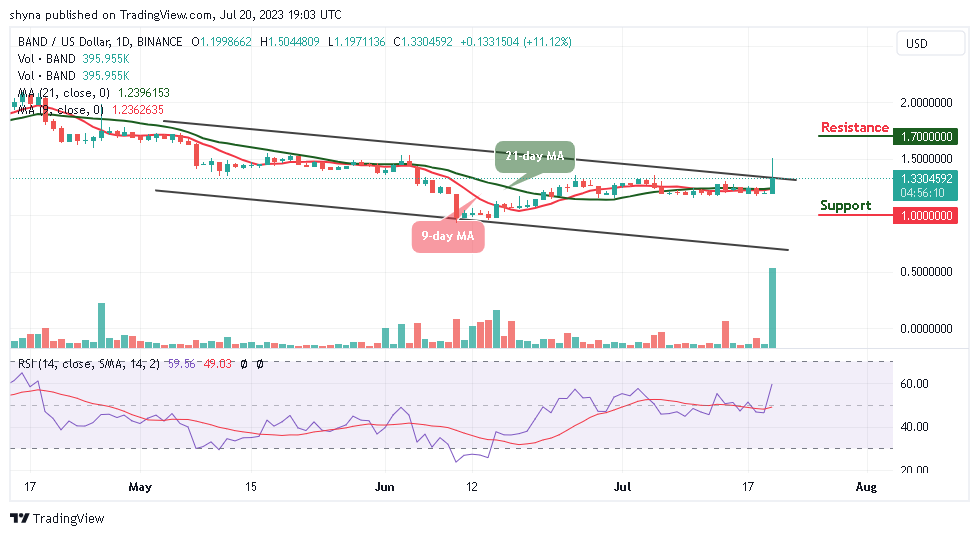
BAND/USD is currently changing hands at around $1.33 as the coin touches the daily high at $1.50 with a market cap of $167.9 million. Today’s trading begins with a slight uptrend in the market as the coin moves to cross above the 9-day and 21-day moving averages. However, traders are anticipating that the current price movement is an indication of the upcoming price rally in the market.
Band Protocol Price Prediction: BAND May Head to the Upside
Looking at the daily chart, the next step for the Band Protocol price is to cross above the channel. Once this is done, bulls may now push the coin to hit the nearest resistance level of $1.60 before locating the potential resistance levels at $1.70, $1.80, and $1.90 respectively.
However, as the technical Indicator Relative Strength Index (14) moves to cross above the 60-level, BAND/USD may continue to move to the north, once this plays out, it can manage to sustain the bullish movement above the upper boundary of the channel. Meanwhile, if the price decides to make a quick turn to the south, the support levels could be found at $1.00, $0.90, and $0.80 if heading toward the lower boundary of the channel.
Against Bitcoin, the Band Protocol is hovering above the 9-day and 21-day moving averages. At the moment, bulls may continue to push the coin to the positive side as the technical Indicator Relative Strength Index (14) moves to cross above the 60-level.
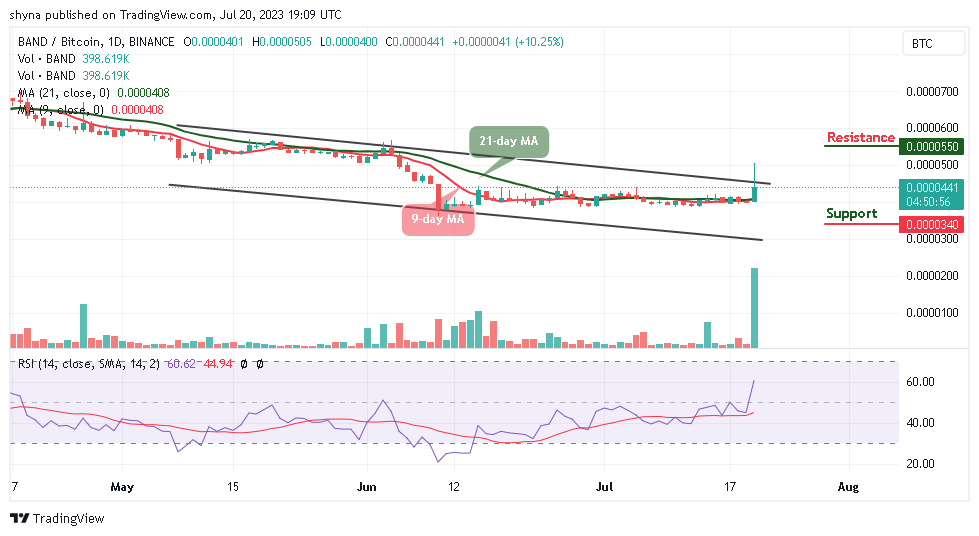
However, if the bulls push and keep the price above the upper boundary of the channel, BAND/BTC could rise to the resistance level of 550 SAT and above. On the contrary, any bearish movement toward the lower boundary of the channel could bring the price toward the support level of 340 SAT and below.
Alternatives to Band Protocol
The Band Protocol price is trading above the 9-day and 21-day moving averages to hit the resistance level of $1.50. The coin may continue to rise if the price crosses above the upper boundary of the channel.
Meanwhile, Band Protocol could end this week on a better note, as the price could make a bullish cross above the channel.
Despite entering a saturated meme coin market, where hundreds of new tokens are launched each week, $WSM has emerged as a promising contender. Raising close to $17 million in its presale, the project’s successful launch showcases the substantial community backing already in place.
Wall Street Memes – Next Big Crypto

- Early Access Presale Live Now
- Established Community of Stocks & Crypto Traders
- Featured on BeInCrypto, Bitcoinist, Yahoo Finance
- Rated Best Crypto to Buy Now In Meme Coin Sector
- Team Behind OpenSea NFT Collection – Wall St Bulls
- Tweets Replied to by Elon Musk
Join Our Telegram channel to stay up to date on breaking news coverage
Credit: Source link


 adds a weekly 14%. Is the cryptocurrency now bullish?")

 Joins Dogecoin, XRP, and Cardano in the $1 Race. Who Will Reach This Milestone First?")


 Bitcoin
  Ethereum
  Tether
  BNB
BNB  Solana
  USDC
USDC  XRP
XRP  Dogecoin
  Toncoin
  Cardano
  Shiba Inu
  Avalanche
  Polkadot
  Wrapped Bitcoin
  Bitcoin Cash
  Polygon
  NEAR Protocol
  Litecoin
  LEO Token
  Uniswap
  First Digital USD
  Aptos
Aptos  Hedera
  Cosmos Hub
  Filecoin
  Stellar
  Pepe
Pepe  Immutable
  Render
  XT.com
  OKB
OKB  Optimism
  Arbitrum
  dogwifhat
  Bittensor
  Sui
Sui  Wrapped eETH
  Maker
Maker 
