Bitcoin Cash Price Prediction – October 17
The Bitcoin Cash price withdraws from monthly high at $648 which is necessary for the next rally as long as $580 support is not broken.
BCH/USD Market
Key Levels:
Resistance levels: $700, $720, $740
Support levels: $520, $500, $480
For the past few days, BCH/USD price has been moving in sideways to support the market, against selling pressure. However, should Bitcoin Cash fall back to the old support and break-even, the bears might come back to dominate the market but at the time of writing, the bears are still in charge. Therefore, traders can expect a bearish movement before any rebound come into play.
Bitcoin Cash Price Prediction: Bitcoin Cash (BCH) Not Yet for Bullish Movement
As the daily chart reveals, the Bitcoin Cash is currently shifting its focus to $500 after clearing resistance at $600, although, the coin has been unstable for the past few days of trading. Nevertheless, the Bitcoin Cash touches $628 in the early hours of today before plunging back to $590. At the time of writing, Bitcoin Cash is following a sideways movement and cross below the 9-day moving average may bring the coin into the negative side.
On the other hand, if the market drives below the $570 support, the BCH price may slump to the initial support at $550, which may later bring the price back to its critical supports at $520, $500, and $480. Presently, the technical indicator Relative Strength Index (14) is likely to cross below 50-level, this could increase the selling pressure and it may likely break below the 21-day moving average.. Meanwhile, a bullish reversal above the moving averages could hit the resistance levels at $700, $720, and $740.

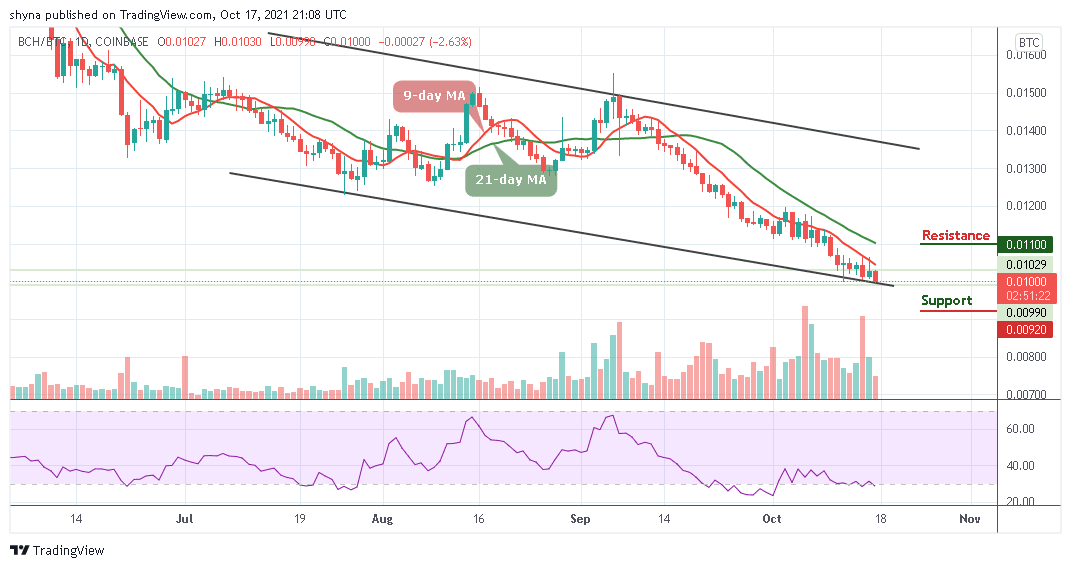
Against Bitcoin, the daily chart reveals that the bears are still moving below the 9-day and 21-day moving averages. However, following the recent negative signs, the trend may continue to go down if the bears continue to pump more pressure into the market.

However, as the technical indicator Relative Strength index (14) signal line moves below 40-level, if the buyers can hold the support of 1000 SAT, the market price may begin an upward movement, pushing further can take it to the resistance level of 1100 SAT and SAT but a cross below the lower boundary of the channel could lower the price to 920 SAT and below.
Looking to buy or trade Bitcoin Cash (BCH) now? Invest at eToro!
67% of retail investor accounts lose money when trading CFDs with this provider
Credit: Source link


 Bitcoin
  Ethereum
  Tether
  Solana
  USDC
USDC  XRP
XRP  Lido Staked Ether
  Toncoin
  Dogecoin
  Cardano
  Shiba Inu
  Avalanche
  TRON
TRON  Wrapped Bitcoin
  Polkadot
  Bitcoin Cash
  NEAR Protocol
  Chainlink
  Polygon
  Litecoin
  Internet Computer
  LEO Token
  Fetch.ai
  Dai
Dai  Uniswap
  Pepe
Pepe  Render
  Hedera
  Ethereum Classic
  First Digital USD
  Aptos
Aptos  Immutable
  Cronos
  Cosmos Hub
  Wrapped eETH
  Mantle
  Filecoin
  Stellar
  Stacks
  OKB
OKB  Renzo Restaked ETH
  dogwifhat
  Arweave
  The Graph
  Arbitrum
  Optimism
  Maker
Maker  Bittensor
