
Bitcoin Price Prediction – January 29
There has been a continual featuring of buying moments in the BTC/USD trading operations as the crypto market rallies, averaging $40,000. The current upward pressures are seemingly hipping up to form a pattern for a selling pressure toward the value line. Price is currently trading around $38,000 at a minute positive percentage of about 0.55.
BTC/USD Market
Key Levels:
Resistance levels: $40,000, $42,500, $45,000
Support levels: $35,000, $32,500, $30,000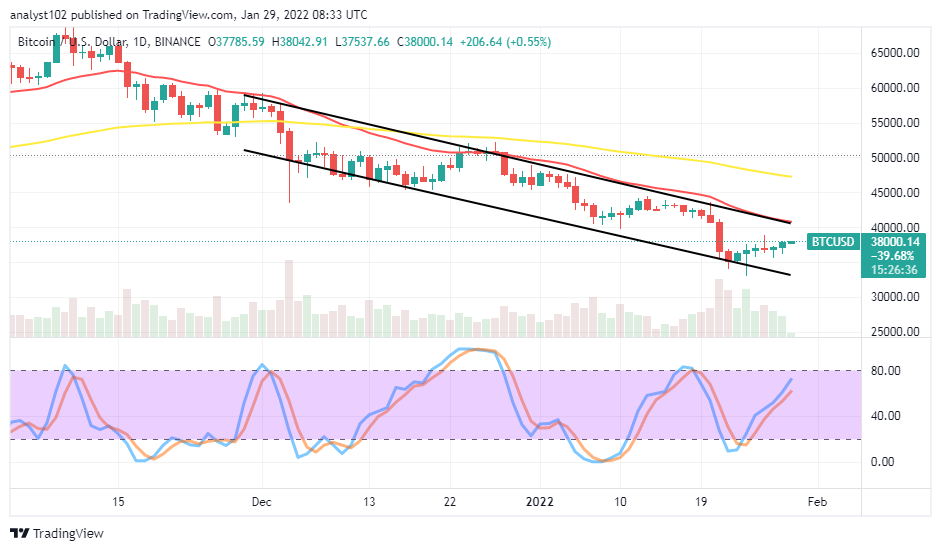
BTC/USD – Daily Chart
The BTC/USD daily chart showcases the crypto-economic market rallies, averaging $40,000. That value line and $37,500 level have been experiencing the upswing attempts over a session. The upper bearish channel trend line drew alongside the 14-day SMA indicator, pointing toward the south underneath the 50-day SMA indicator. The Stochastic Oscillators have slantingly moved northbound closer to the range of 80. That signifies the crypto economy is struggling to regain parts of its lost momentums to the US economy lately.
Will the BTC/USD trade surge higher as the crypto-economic market rallies, averaging $40,000?
Going by the BTC/USD trade current surging pace outlook, price appears gradually getting reduced in its capacity as the crypto-economic market rallies, averaging $40,000 resistance level. Therefore, long-position takers are to put further buying activities on hold for a while, especially if a sudden sustainable hike cannot achieve past above the value line in question.
On the downside of the technical analysis, it seems promising that the present rallying motion tends to get exhausted soon after reaching for resistances around $40,000. In the meantime, some buying forces are relatively resurfacing as bears have been anxiously awaiting its reversal mode to launch a sell order. Nevertheless, short-position takers still have to exercise some degree of patience in achieving that situation.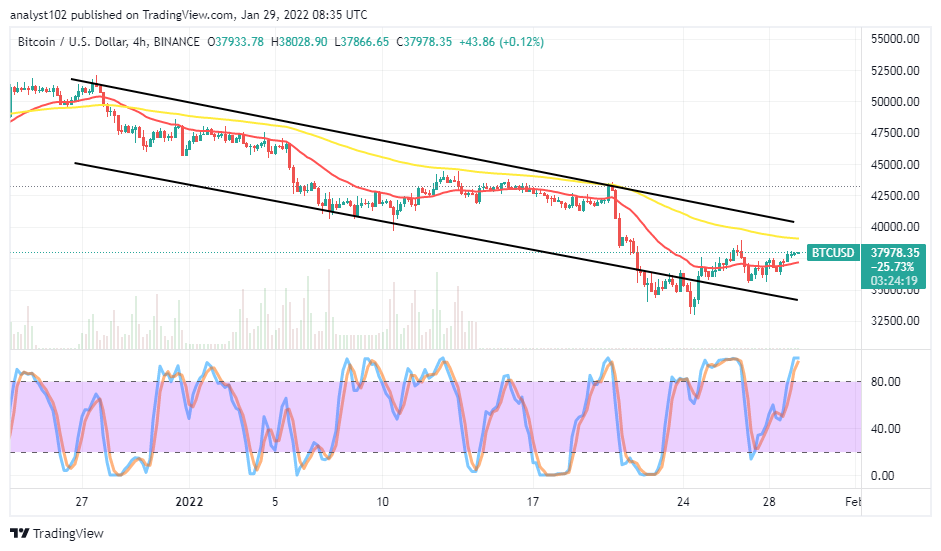
BTC/USD 4-hour Chart
The BTC/USD 4-hour chart exhibits the crypto market rallies briefly past the $37,500 level. The 50-day SMA indicator is beneath the $40,000 level above the 14-day SMA indicator. The bearish channels drew southward to embody the SMA trend lines. The Stochastic Oscillators have penetrated the overbought region. And they now attempt to close their lines within it. That signifies that the crypto’s price may soon lose momentum to the downside in the near time.
Looking to buy or trade Bitcoin (BTC) now? Invest at eToro!
68% of retail investor accounts lose money when trading CFDs with this provider.

Read more:
Credit: Source link


 Bitcoin
  Ethereum
  Tether
  BNB
BNB  Solana
  USDC
USDC  XRP
XRP  Dogecoin
  Toncoin
  Cardano
  Shiba Inu
  Avalanche
  Wrapped Bitcoin
  Bitcoin Cash
  Polkadot
  NEAR Protocol
  Polygon
  Litecoin
  Uniswap
  LEO Token
  First Digital USD
  Hedera
  Aptos
Aptos  Stellar
  Cosmos Hub
  Filecoin
  OKB
OKB  Immutable
  Render
  XT.com
  Pepe
Pepe  Arbitrum
  Bittensor
  dogwifhat
  Maker
Maker  Wrapped eETH
  The Graph
  Optimism
 Network Odsy")