Bitcoin Cash Price Prediction – December 26
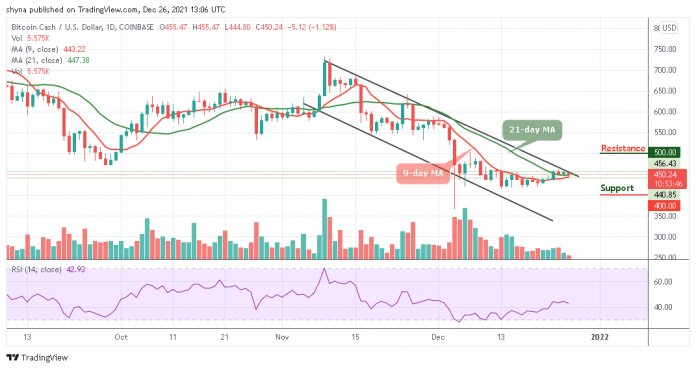
The Bitcoin Cash price struggles to stay above $450 as bears call for $444 while the coin could settle in consolidation around $400.
BCH/USD Market
Key Levels:
Resistance levels: $500, $520, $540
Support levels: $400, $380, $360
BCHUSD – Daily Chart
At the time of writing, BCH/USD is pushing for consolidation around $450 but the trend has a bearish inclination, which may likely test the support at $420 if it crosses below the 9-day and 21-day moving averages. More so, the technical indicator is still bearish as the Relative Strength Index (14) may cross below 40-level to dig deeper in the negative region as the signal line reflects the influence the sellers have over the price.
Bitcoin Cash Price Prediction: Can BCH Price Go Further Lower?
According to the daily channel, the best the bulls can do is defending the support at $450 and focus on pulling towards $460. In the past few days, the Bitcoin Cash price lost balance alongside other cryptos and the sharp drop affected the buyers from an attempted recovery above the upper boundary of the channel. However, BCH/USD is making an attempt to cross below the 9-day and 21-day moving averages.
Moreover, the coin is currently at the negative side, therefore a reflex bullish action is expected to correct the declines with a possible jump above $455. Meanwhile, if there is an increase in buying pressure, the price may break above the upper boundary of the channel to reach the $480 resistance. While trading at that level, the bullish continuation could push the coin to the resistance levels of $500, $520, and $540.

On the contrary, a minimum swing to the south may likely bring the market to a $420 support level. Moreover, this level could take the bears to the critical support levels of $400, $380, and $360 respectively.
Against Bitcoin, the bears are still showing more commitment within the channel. Meanwhile, as the market price follows the recent negative sign, the trend may continue to follow the downtrend in as much as the buyers failed to push the price above the 9-day and 21-day moving averages.

BCHBTC – Daily Chart
However, as the signal line of Relative Strength Index (14) is seen below 40-level, crossing above 40-level may likely cause the coin to begin an upward trend in order to touch the resistance level of 950 SAT and above but a retest could lower the Bitcoin Cash price to the support level of 850 SAT and below.
Looking to buy or trade Bitcoin Cash (BCH) now? Invest at eToro!
68% of retail investor accounts lose money when trading CFDs with this provider
Credit: Source link


 Bitcoin
  Ethereum
  Tether
  Solana
  USDC
USDC  Lido Staked Ether
  XRP
XRP  Dogecoin
  Toncoin
  Cardano
  Shiba Inu
  Avalanche
  TRON
TRON  Wrapped Bitcoin
  Bitcoin Cash
  Polkadot
  Chainlink
  NEAR Protocol
  Polygon
  Litecoin
  Internet Computer
  Uniswap
  LEO Token
  Dai
Dai  First Digital USD
  Ethereum Classic
  Aptos
Aptos  Hedera
  Stacks
  Cronos
  Mantle
  Stellar
  Filecoin
  Cosmos Hub
  Renzo Restaked ETH
  OKB
OKB  XT.com
  Render
  Pepe
Pepe  Immutable
  Arbitrum
  dogwifhat
  Wrapped eETH
  Bittensor
  Optimism
  Maker
Maker  The Graph
