
In a recent analysis of the Bitcoin price, seasoned crypto analyst Rekt Capital discussed the looming presence of a potential double top formation on the weekly chart. The scenario paints a picture of impending volatility, with both bullish and bearish narratives emerging from this often foreboding pattern.
“The BTC Double Top still remains intact,” tweeted Rekt Capital, emphasizing the technical structure’s significance. He continues, “Weekly Bearish Divergence lends additional bearish confluence to this structure as well. More, the bear div is developing a new lower high (dotted green) relative to its primary downtrend (solid green).” However, BTC would need to drop an additional -9% to -13% from current prices to complete its potential double top.
But what makes this analysis particularly intriguing is the current state of Bitcoin’s volume. Rekt Capital further observes, “What’s interesting about the volume behind BTC’s price action is that the two recent peaks formed on inclining volume while the RSI formed lower highs.” For many, this simultaneous increase in volume with descending RSI hints at underlying market weakness, an insight further supported by the subsequent declining volume after the local top at approximately $31,000.
Diving deeper in his video analysis, Rekt Capital highlighted the need for a distinct “M”-shaped formation, a hallmark of the double top pattern. “For Bitcoin to form a double top here, we have to see an ‘M’-shaped formation take place. When we see a M form, that’s essentially a double top. One top here [at $30,800] and one top here [at $31,300].”
Losing pivotal support levels could invite substantial downward movement. “Losing this [neckline] level at $26,000 as support would enable further downside,” warns the analyst. However, for traders and investors hoping for symmetrical behavior, Rekt Capital speculates, “And if we see symmetry here, a three month second part of this M could form so that’s going to prompt further downside and just slow bleeding into that 90 day-mark which would be around next month.”
But not all is bleak. Should Bitcoin trace back to $24,000, a retracement would “see us retest the neckline of this inverse head & shoulders that we saw break out.” Rekt Capital adds, “So a retest of this level as a new support should actually enable further upside.”
Also, a look at the 1-week chart also shows that there is another scenario for the invalidation of the double top. Bitcoin has formed an ascending trendline from its low in early January. Provided BTC can hold this trendline on a weekly basis and bounce up from there (at around $28,200), an invalidation would take place. The symmetry of the M would be broken, the uptrend on the higher time frames could continue.
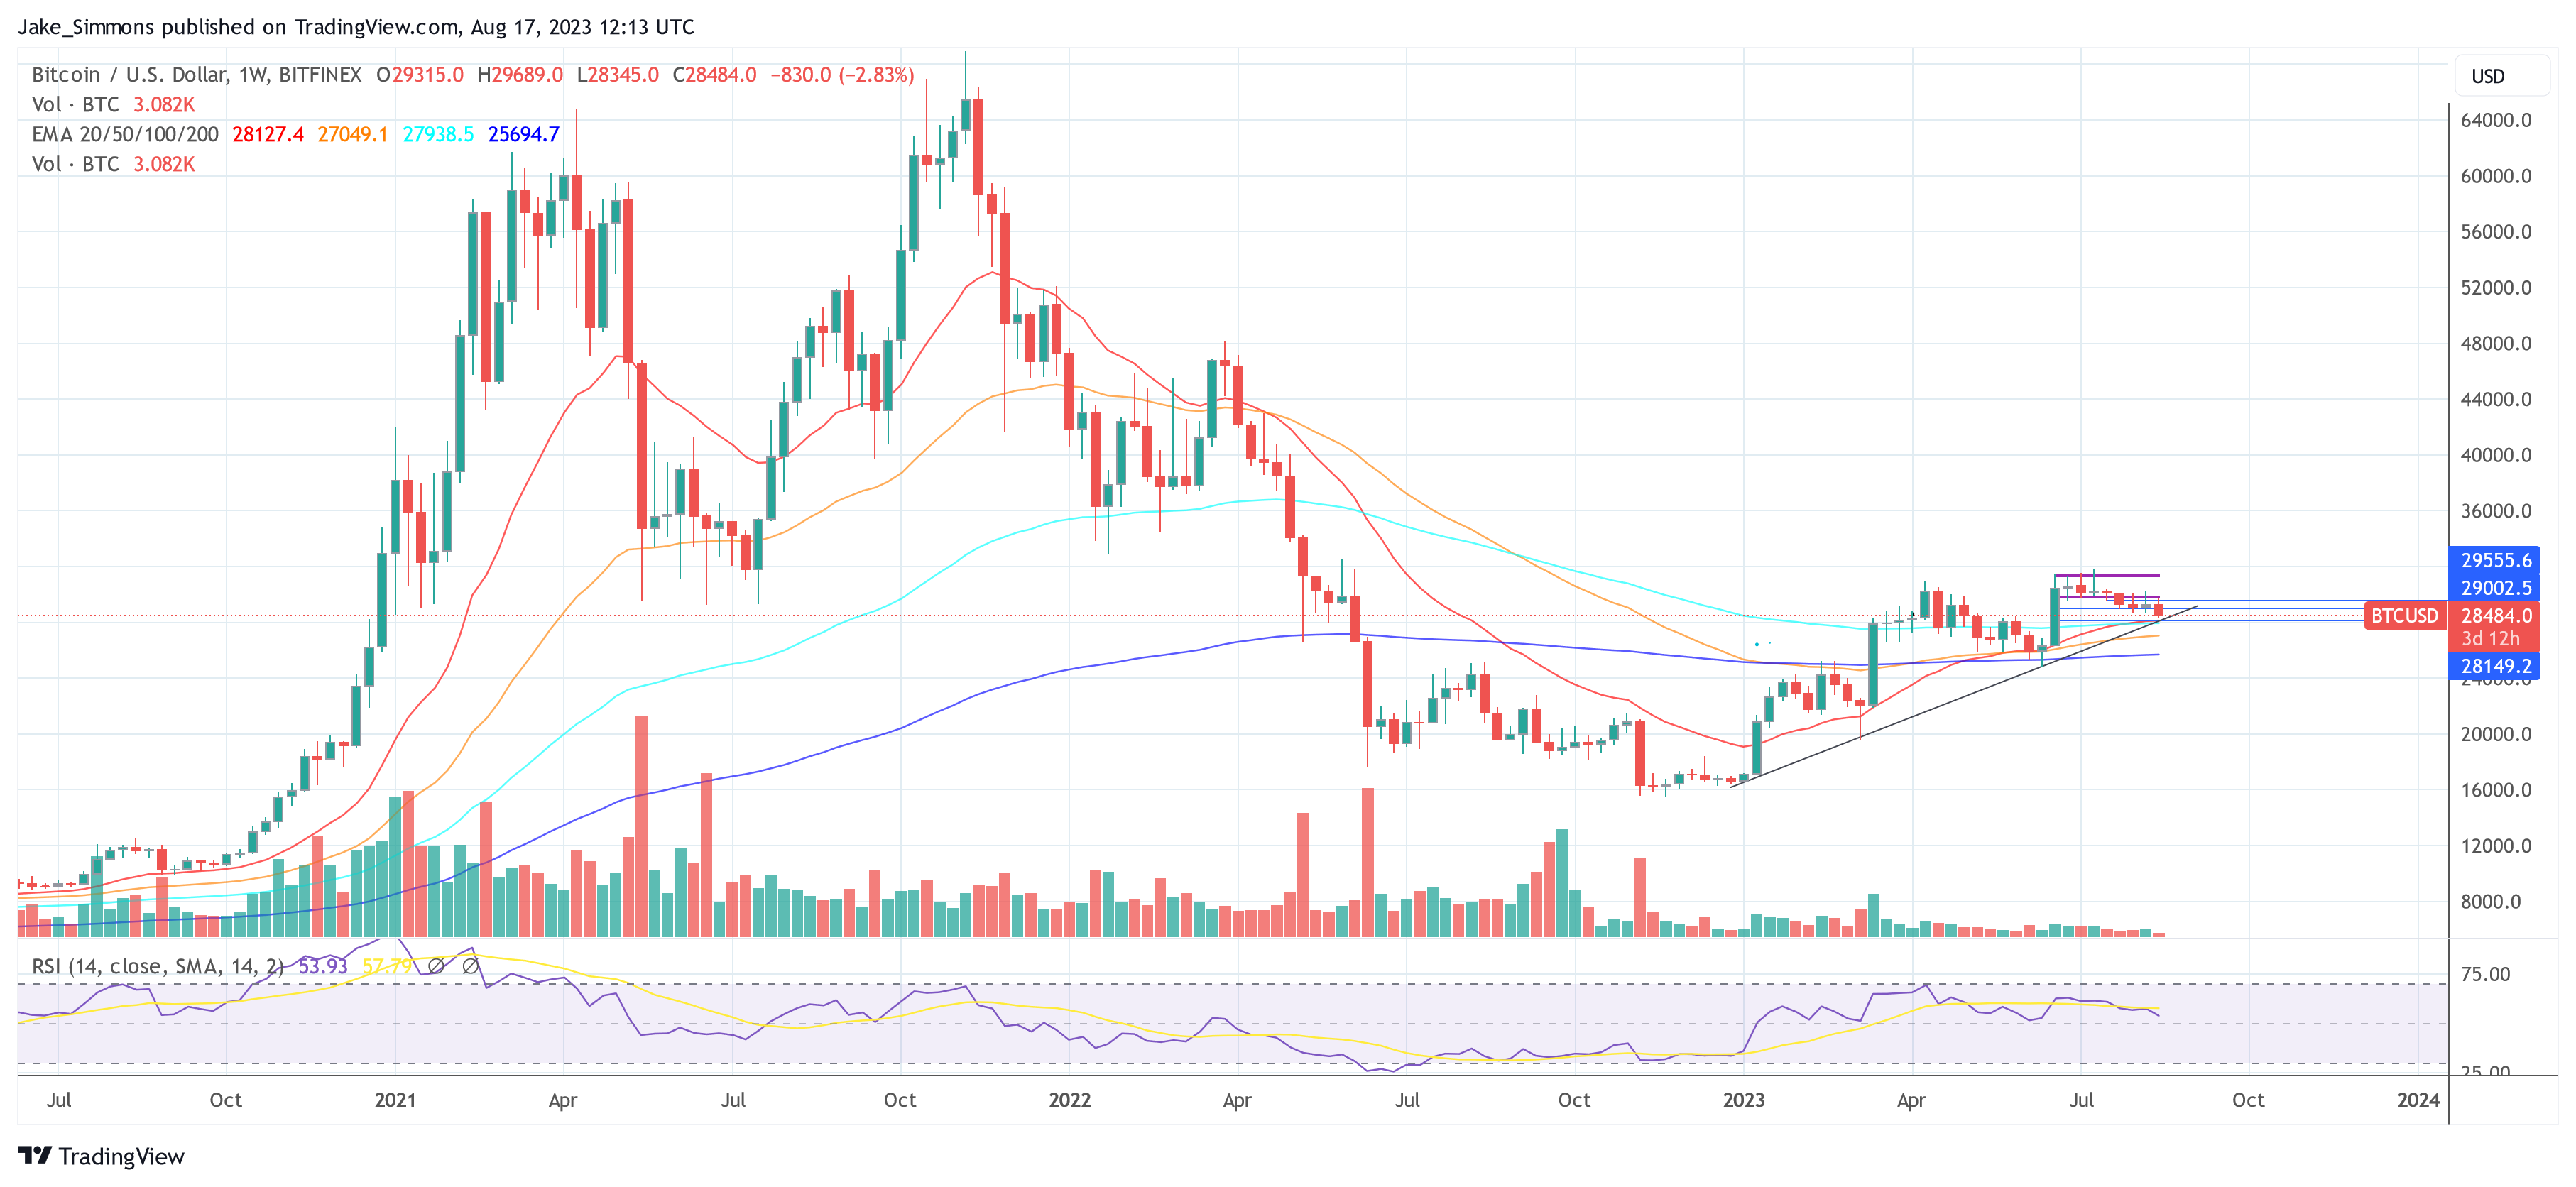
Featured image from iStock, chart from TradingView.com
Credit: Source link


 Bitcoin
  Ethereum
  Tether
  BNB
BNB  Solana
  USDC
USDC  XRP
XRP  Dogecoin
  Toncoin
  Cardano
  Shiba Inu
  Avalanche
  Wrapped Bitcoin
  Bitcoin Cash
  Polkadot
  NEAR Protocol
  Polygon
  Litecoin
  Uniswap
  LEO Token
  First Digital USD
  Aptos
Aptos  Hedera
  Stellar
  Filecoin
  Cosmos Hub
  XT.com
  OKB
OKB  Render
  Pepe
Pepe  Immutable
  Arbitrum
  Bittensor
  Wrapped eETH
  Maker
Maker  Optimism
  dogwifhat
  The Graph
