
The article below is an excerpt from a recent edition of Bitcoin Magazine PRO, Bitcoin Magazine’s premium markets newsletter. To be among the first to receive these insights and other on-chain bitcoin market analysis straight to your inbox, subscribe now.
Bitcoin Market Dynamics
The goal of this article is to zoom out and highlight some of the latest bitcoin market moves through the lens of on-chain data: realized price, profit-taking behavior and bitcoin supply levels.
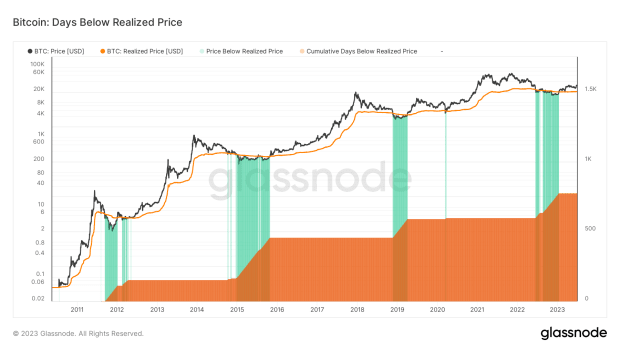
Currently, bitcoin is trading at approximately 1.5x its realized price, which recently resurged past the $20,000 mark. This milestone provides an interesting perspective and other on-chain data helps us paint a more comprehensive picture. Following typical bitcoin capitulation events, the supply often gets constrained by the participants with the most conviction. We now find ourselves precisely in such a phase: A mere 13% of circulating supply is held on exchanges and in the hands of short-term holders.
However, it’s important to note that while current price action and realized profits do not necessarily support the notion of a full-fledged bull market, we thus far have witnessed previous realized losses/on-chain capitulation turning into a small yet steady stream of profits (old coins moving at a higher price level than they were acquired for).
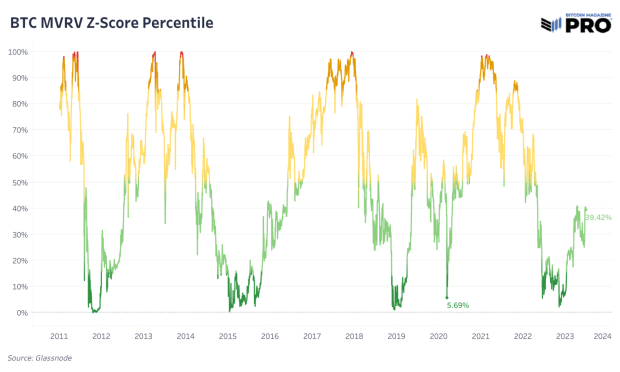
As shown below, the market-value-to-realized-value metric paints a picture of the birth of a nascent new bull market, with valuations no longer at bottom-barrel levels but still far from relatively overpriced, currently ranking in the 39% of historical readings.
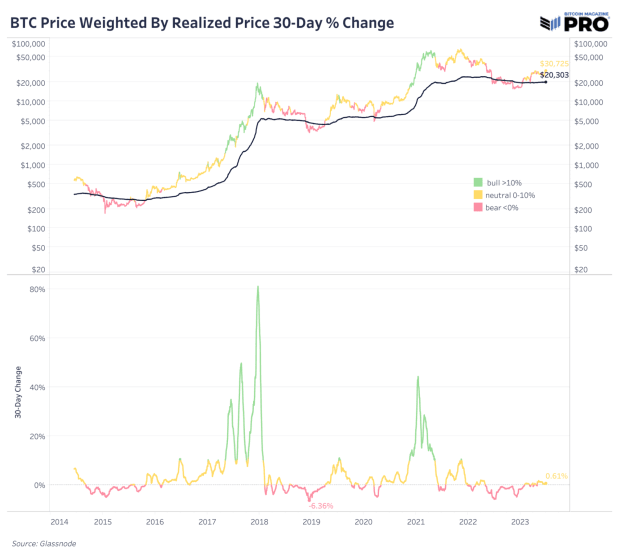
Looking at the rate of change of the realized price, the historical analog of the current market look to be the early months of 2016 and the summer of 2019, where price had sufficiently rebounded off the lows, with most of the bleeding finally over, as the market consolidated amid constrained supply conditions and a growing network effect of real world adoption.
Realized Cap, Not Market Cap
The logarithmic chart of bitcoin’s realized market capitalization, reflecting the aggregate value of all bitcoin at their last traded price, demonstrates the asset’s resilience. Unlike market cap, which is the product of circulating supply and current price, the realized cap shows the precise value of each bitcoin UTXO, courtesy of its transparent ledger.
Realized cap paints a far different picture regarding bitcoin’s monetization compared to what one may be led to believe when viewing bitcoin’s hyper-volatile mark-to-market exchange rate.
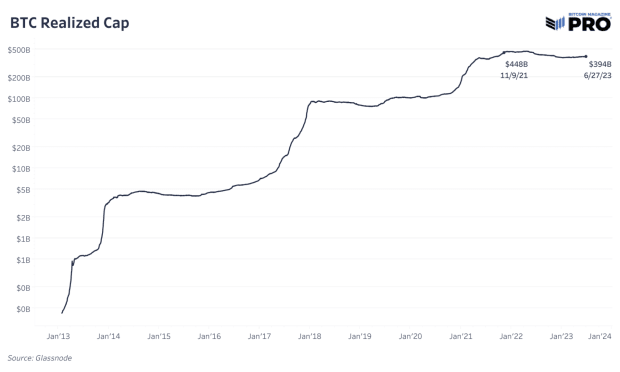
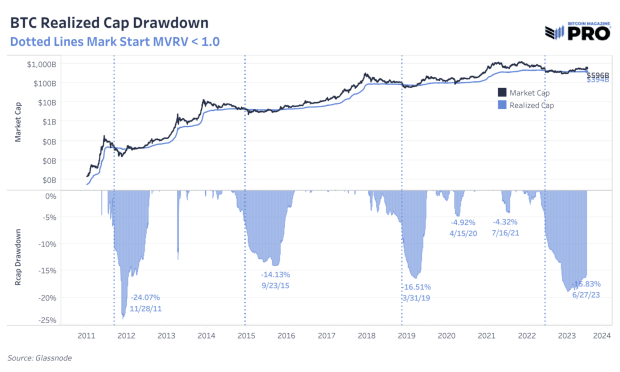
A mere 15% below the realized market cap all-time high, capital inflows have returned, resembling previous bear market recoveries. During recovery periods following bitcoin bear markets, we have seen a reclaim of the previous all-time high in realized market cap while bitcoin was still 40%-60% below its all-time high exchange rate. This historical dynamic demonstrates a couple things:
First, it suggests that capital inflows can continue to seep into bitcoin without necessarily triggering a raging bull market, instead leading to an environment of chop and consolidation. This is often characterized by a tug-of-war between marginal buyers and sellers, where price levels witness repeated tests of resistance and support, all while accumulation from HODLers continues under the surface.
Second, it shows a historical reality where bitcoin’s true valuation — the price where all its supply has traded hands — surpasses the all-time high long before the media frenzy and new wave of speculative inflows arrive again. One can view this as an ode to the “smart money” investors, who don’t need the explicit signal of a nominal exchange rate all-time high to understand that bitcoin’s fundamentals are stronger than ever.
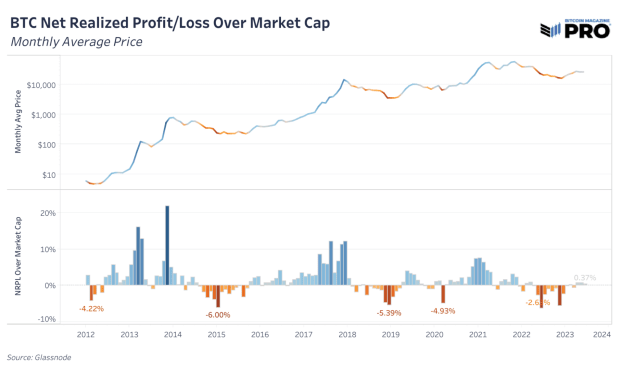
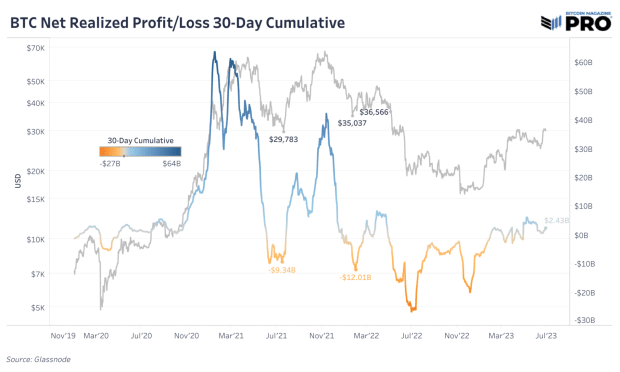
A demonstration of this dynamic is the net realized profits relative to the bitcoin market cap. Following the worst of a bear market capitulation, bitcoin market inflows are distinctly positive (but not yet over zealous) while the exchange rate grinds higher to eventually flirt with price all-time highs.
Once the all-time high is broken, inflows ramp up dramatically. The setup for this market cycle is still in the early stages.
Unrealized Profit/Loss
We’ve examined realized profit and loss cycles, so now let’s turn to the unrealized side of the equation.
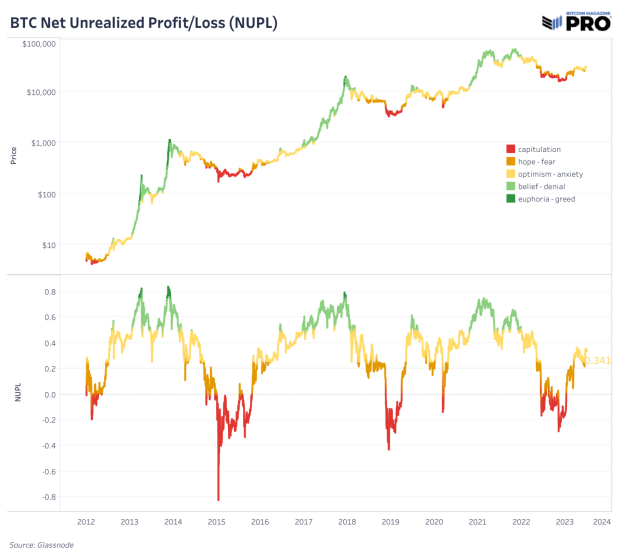
Relative Unrealized Profit/Loss (NUPL) is an insightful metric designed to gauge investor sentiment in the bitcoin market by calculating the total unrealized gains or losses across the current supply. To calculate the NUPL, subtract the realized cap (which represents the value of each bitcoin when it last moved on the blockchain) from the market cap, then express this difference as a ratio of the market cap. This metric works to standardize the state of the unrealized profits/losses held by investors using the market capitalization to account for an ever changing market valuation.
- A higher ratio typically suggests a state of greed or speculative froth among investors, indicative of potential market tops or overbuying conditions.
- In contrast, a lower ratio generally signals an atmosphere of fear or capitulation, potentially pointing to market bottoms or overselling scenarios.
In the current climate, NUPL stands at 0.37, a level we can categorize as optimism/anxiety, depending on the trend direction.
It’s noteworthy that the bitcoin market has never seen a recovery in NUPL from the capitulation phase to the optimism phase without a subsequent visit to one or both of the two highest tiers of NUPL: belief and euphoria.
Translated into simpler terms, this suggests that bitcoin market recoveries, even from the most severe conditions, lead to brighter days ahead due to the resilience of the bitcoin HODLer base and a consistent transfer of coins from weak hands to strong ones. The ongoing wealth transfer underpins market recoveries, reinforcing bitcoin’s inherent strength and setting the stage for further growth and potential price appreciation during the next period of capital inflows.
Having just recovered from the depths of the bear market in late 2022, the setup now mirrors historical market recoveries of past cycles, as bitcoin once again climbs the wall of worry.
Free Float Constraints And UTXO Distribution
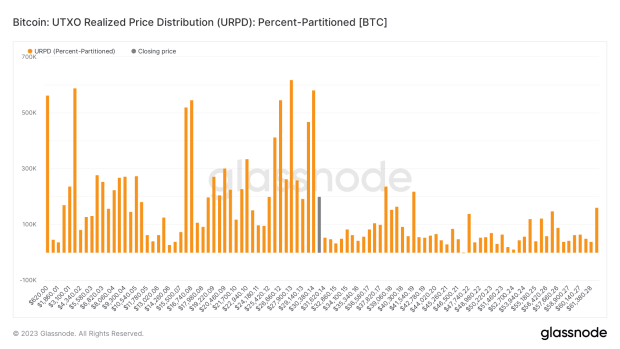
Another metric we can look at to show just how sparse the figurative air is above the current trading range is the UTXO Realized Price Distribution (URPD).
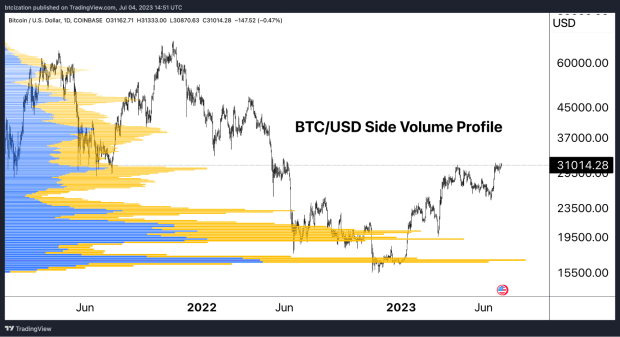
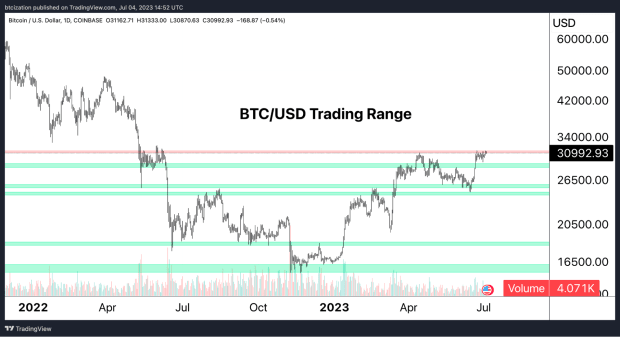
The URPD reveals that above $31,000, only a limited supply has exchanged hands, with the majority of transactions occurring in the $15,000-$30,000 range. The first major resistance point from a supply distribution level is around $40,000. This also aligns with the spot volume trading distribution, as well as the technical breakdown of the chart.
With bitcoin looking to spring past the levels last visited around the time of the LUNA/UST-induced crypto contagion, demise of multiple exchanges and the industry’s largest hedge fund, Three Arrows Capital, what can turn the bullish setup into a reality?
Capital inflows and a primed supply side that is constrained to historic levels.
Looking at the free float supply of bitcoin, what we define as exchanges’ balances in addition to short-term holder supply, the current setup points to the tightest supply conditions bitcoin has ever experienced.
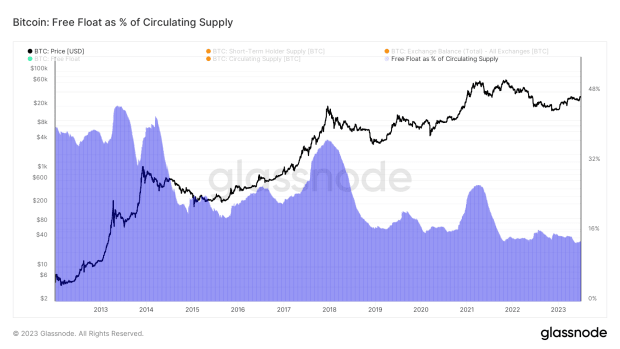
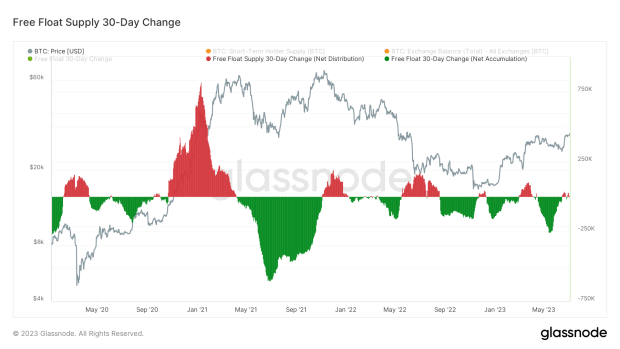
While it is true that supply has been sufficiently constrained from a historical context since early 2022, we view the dynamic a bit differently today, with the nascent bitcoin market having endured its largest capitulation period ever.
Relatedly, we can see a steady dose of accumulation occurring throughout the course of the two years, with contagion events being the only things to temporarily reverse the trend.
We expect the abundance of positive news stories related to bitcoin spot ETF filings to materialize in continued positive inflows, with plenty of opportunistic investors and speculators looking to front run the approval and launch of spot bitcoin ETFs by legacy institutions.
While we expect that the approval of an ETF to come somewhere in the late months of 2023 or early months of 2024, the cycle reset coupled with primed supply-side conditions could lead to continued positive price action through year’s end.
In our view, macro correlations and market conditions still hold significance in the bitcoin market, but the idiosyncratic catalysts of a potential spot ETF approval and the halving arriving near the same time — plus rate cuts likely to arrive in 2024 — has us leaning bullish.
In the short-term, bitcoin ranging from anywhere between $20,000-$40,000 wouldn’t be surprising with such an illiquid market.
However, taking a longer view, the supply-side dynamics and potential for increased demand flows is eerily similar to the setups that led to previous raging bull markets.
That concludes the excerpt from a recent edition of Bitcoin Magazine PRO. Subscribe now to receive PRO articles directly in your inbox.

Credit: Source link


 Bitcoin
  Ethereum
  Tether
  BNB
BNB  Solana
  USDC
USDC  XRP
XRP  Dogecoin
  Toncoin
  Cardano
  Shiba Inu
  Avalanche
  Wrapped Bitcoin
  Bitcoin Cash
  Polkadot
  NEAR Protocol
  Polygon
  Litecoin
  Uniswap
  LEO Token
  First Digital USD
  Hedera
  Aptos
Aptos  Stellar
  Cosmos Hub
  OKB
OKB  Filecoin
  Immutable
  Render
  XT.com
  Pepe
Pepe  Arbitrum
  Bittensor
  dogwifhat
  Maker
Maker  Wrapped eETH
  The Graph
  Optimism
