
- It is a wait and see situation as over 76% Bitcoin supply are now held in illiquid wallets, Glassnode.
- The market sentiment remains bearish with an extremely fear score on the Fear and Greed Index.
- BTC remains bullish as it trades above the weekly trendline.
Bitcoin (BTC) had one of the least volatile years in 2021 with around 139% variation between the highest and the lowest Bitcoin price points. That is not to say that Bitcoin did not have its share of challenges as the BTC price action allowed investors more entry and exit levels as profit taking characterised some of the price corrections.
From China banning cryptocurrencies for the nth time to the total outlaw of Bitcoin mining in China as well as increasing regulation of crypto’s and the blockchain industry across the world, the pioneer crypto had its best year as the financial markets entered the post-pandemic era.
Bitcoin adoption increased with the first country, El Salvador approving BTC as legal tender and institutions like MicroStrategy increasing their Bitcoin reserves.
Against this background, its is suffice to state that the Bitcoin price remains bullish in the long-term with enthusiasts like the El Salvador president, Nayib Bukele, predicting a $100,000 for the BTC price by the end of the year 2022.
2022 predictions on #Bitcoin:
•Will reach $100k
•2 more countries will adopt it as legal tender
•Will become a major electoral issue in US elections this year
•Bitcoin City will commence construction
•Volcano bonds will be oversubscribed
•Huge surprise at @TheBitcoinConf— Nayib Bukele 🇸🇻 (@nayibbukele) January 2, 2022
However, BTC/USD price action has been uneventful over the last few week as it continues to trade in a sideways price action between the $52,000 and $45,500 range as shown on the weekly chart. The Crypto Fear and Greed Index is in the Extreme Fear zone registering a value of 24/100 on Wednesday.
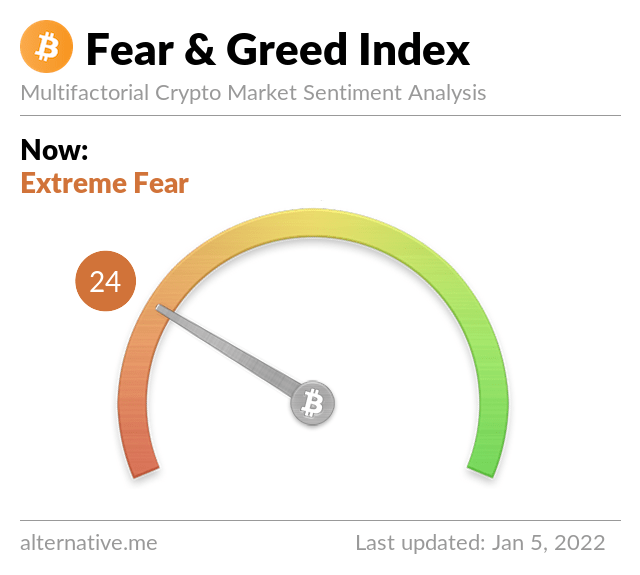
However, according to Ecoinmetrics, an on-chain resource analysis company, stages of extreme fear rarely linger for long, meaning they have a downside of around 30 days.
Your capital is at risk
Bitcoin Liquidity Decreases
More than three quarters of the total circulating Bitcoin supply is now in illiquid wallets. According to data from on-chain analytics Glassnode, more BTC has been moved into illiquid wallets. There has been an acceleration in illiquid supply growth which now comprises more than 76%, of BTC’s total circulating supply.
The findings suggest that more Bitcoin is being transferred into storage indicating an increase in accumulation and hodling habits. The decline in highly liquid supply also hints that there may not be a major selloff or capitulation event at any time in the near future, which keeps Bitcoin bulls hopeful.
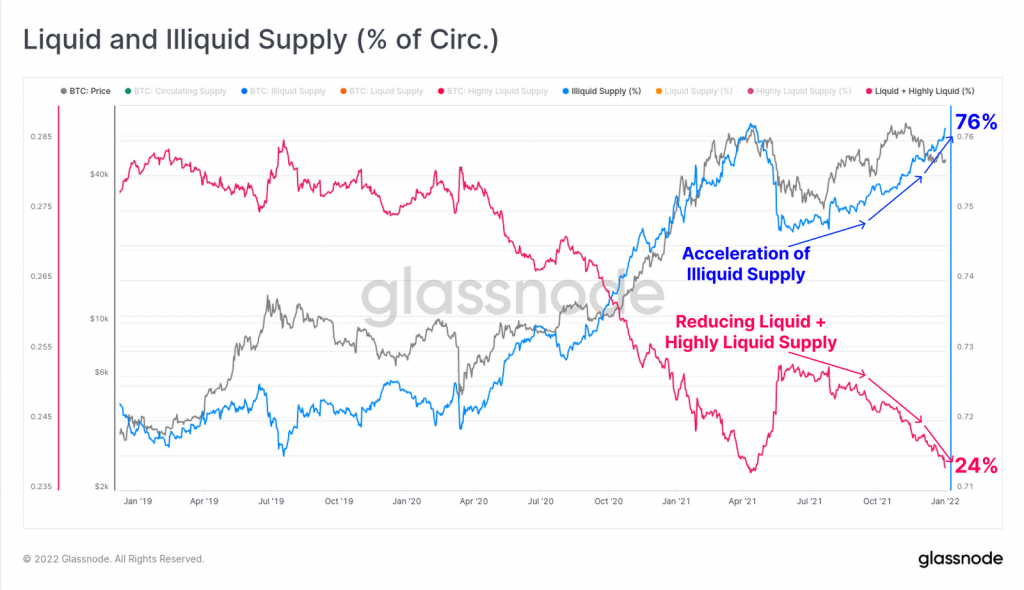
The findings in the Glassnode report suggests there is a divergence between what investors might purport to be constructive on-chain supply metrics, compared to bearish-to-neutral price action.
Your capital is at risk
Bitcoin Price IS Bullish On The Weekly Chart
Bitcoin price is down approximately 2.3% over the last one week to trade around $46,362. BTC/USD price has been consolidating below the $52,000 level for the past four weeks since turning away from its November 10 all-time high above $69,000.
Bitcoin price action appears to be spelling out an ascending triangle chart pattern on the weekly chart. The BTC price upward movement is currently being hindered by the 50-week Simple Movign Average (SMA) at $48,460.
The weekly upward trendline could be suggesting that the current low around S45,587 could be the local bottom for BTC price as it was been a formidable support line for the better part of 2021.
Therefore, if this support holds and Bitcoin bulls manage a closure above the 50-weekly SMA at $48,460, Bitcoin might rise to reclaim the crucial $50,000 level.
A decisive bullish breakout above the aforementioned level could see Bitcoin price rise to tag the $60,000 psychological level or the all -time high around $69,000 embraced by the horizontal resistance line of the ascending triangle.

BTC/USD Weekly Chart
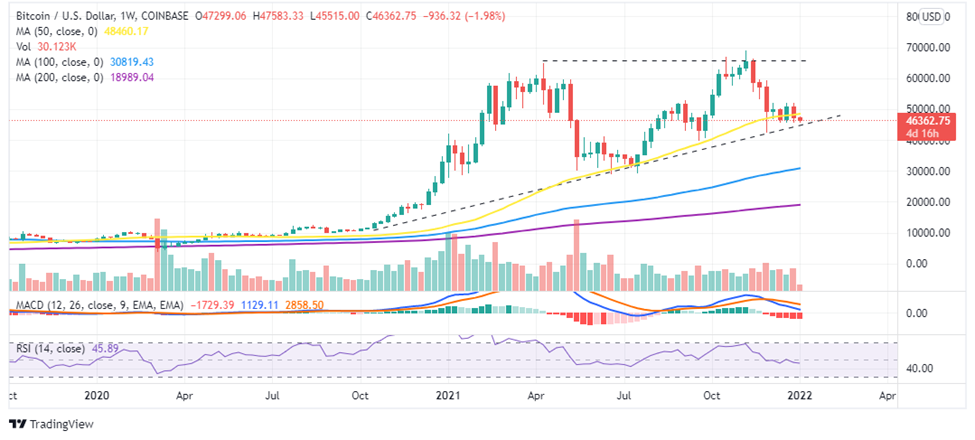
Note that several technical indicators accentuate this bullish outlook for BTC. First, the upsloping moving averages and the fact that Bitcoin is trading above the weekly trendline point to a long-term positive outlook for Bitcoin.
In addition, the position of the Moving Average Convergence Divergence (MACD) indicator above the zero line in the positive zone indicate that the Bitcoin market sentiment is still bullish.
Furthermore, Bitcoin is stilling on robust support downwards provided by the 100 and 200 SMAs $30, 819 and $18,989 respectively.
How Can Bitcoin Price Upswing Be Invalidated?
The aforementioned bullish outlook could be invalidated by a failure to hold on to the immediate provided by the weekly upward trendline at $45, 587 could trigger massive sell orders that could pull the BTC price further down to tag the $44,000 support wall.
If this happens, expect BTC to accumulate at the $44,000 level for several weeks before starting an upswing.
The downward movement of the MACD and the Relative Strength Index (RSI) validate this pessimistic outlook.
Where to buy BTC Cheap now
If you are looking for places to buy Bitcoin cheaply, global crypto exchanges such as eToro are worth a look. Read our guide on the best trading platforms for a review of eToro to find out more about the pioneer on social trading.
With eToro, there are no trading fees, with the platform making its money in the spread between the bid and ask price. The minimum trade size for crypto assets is $25.
Looking to buy or trade Bitcoin (BTC) now? Invest at eToro!
Your capital is at risk
Read more:
Credit: Source link


")


 Can Reach a New ATH This Month")


 Bitcoin
  Ethereum
  Tether
  BNB
BNB  Solana
  USDC
USDC  XRP
XRP  Dogecoin
  Toncoin
  Cardano
  Shiba Inu
  Avalanche
  Wrapped Bitcoin
  Polkadot
  Bitcoin Cash
  NEAR Protocol
  Polygon
  Litecoin
  Uniswap
  Fetch.ai
  LEO Token
  Aptos
Aptos  Hedera
  First Digital USD
  Pepe
Pepe  Cosmos Hub
  Render
  Filecoin
  dogwifhat
  Immutable
  Stellar
  XT.com
  Optimism
  Wrapped eETH
  OKB
OKB  Bittensor
  Arbitrum
  Maker
Maker  The Graph