
The Bitcoin price prediction shows that BTC is currently facing the down, but consolidation is likely to play out between $38,000 and $39,000.
BTC/USD Long-term Trend: Bearish (Daily Chart)
Key levels:
Resistance Levels: $44,000, $46,000, $48,000
Support Levels: $35,000, $33,000, $31,000
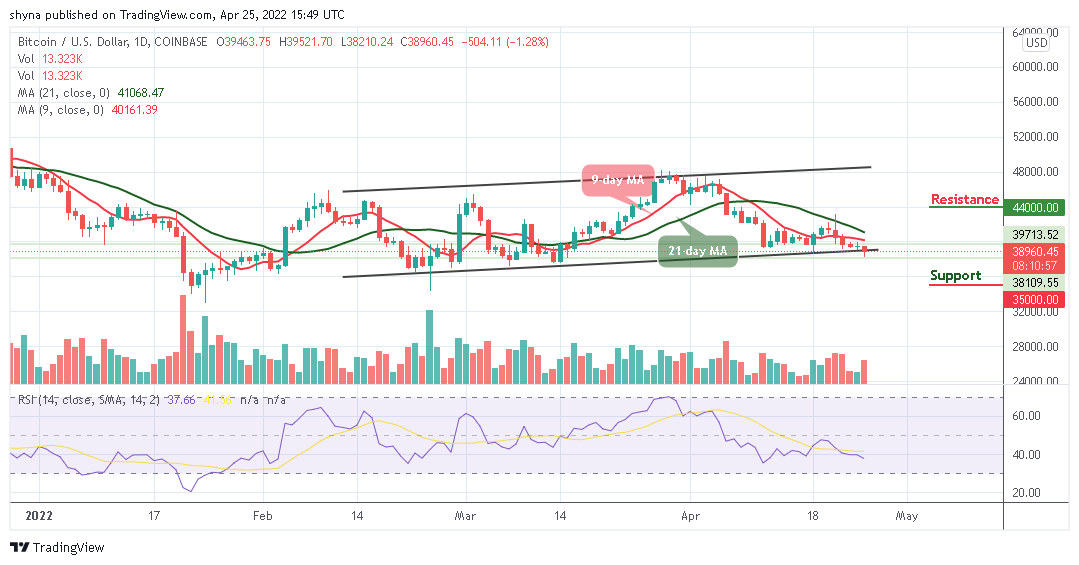
BTC/USD retreats below the resistance level of $39,500. The number-one crypto is now moving below the 9-day and 21-day moving averages as the price heads toward the lower boundary of the channel. However, the Bitcoin price did not stay up for long because of an immediate reversal. Therefore, the daily chart reveals that the market may experience a slight bearish movement.
Bitcoin Price Prediction: Would BTC Rebound Above the Moving Averages?
At the time of writing, the Bitcoin price is hovering at $38,960 with a loss of 1.28% on the day. The trading is likely to face a downtrend as the technical indicator Relative Strength Index (14) crosses below the 40-level. The bulls must reclaim the position above $40,000 as this would allow them to focus on higher levels toward $42,000. On the other side, continued declines under the short-term support at $38,000 could easily open the way to the south.
Meanwhile, the breakdown towards $36,000 is not out of the picture because the losses in the last 24 hours show that BTC/USD may not be technically ready for the breakout above $40,000, but the king coin can still make an attempt to regain ground, and any bullish movement to the upside may push the coin to the resistance level of $44,000, $46,000, and $48,000 while the supports lie at $35,000, $33,000, and $31,000 respectively.

BTC/USD Medium-Term Trend: Bearish (4H Chart)
According to the 4-hour chart, the Bitcoin price is crossing above the 9-day and 21-day moving averages. However, if the price drops and moves towards the lower boundary of the channel, it could reach the nearest support level at $37,500 and below.
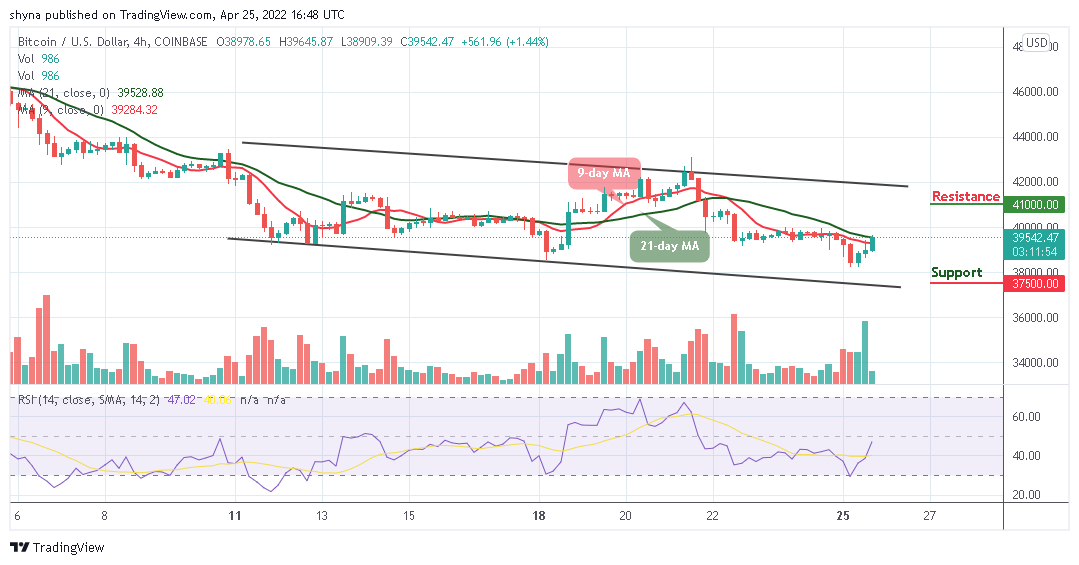
Moreover, if the bulls push the coin towards the upper boundary of the channel, the Bitcoin price may likely reach the potential resistance level of $41,000 and above. Now, the market may continue to rebound as the technical indicator Relative Strength Index (14) moves to cross above 50-level.
Looking to buy or trade Bitcoin (BTC) now? Invest at eToro!
68% of retail investor accounts lose money when trading CFDs with this provider
Credit: Source link


 and Chainlink (LINK) investors sell to buy into…")


 Bitcoin
  Ethereum
  Tether
  BNB
BNB  Solana
  USDC
USDC  XRP
XRP  Dogecoin
  Toncoin
  Cardano
  Shiba Inu
  Avalanche
  Wrapped Bitcoin
  Bitcoin Cash
  Polkadot
  NEAR Protocol
  Polygon
  Litecoin
  Uniswap
  LEO Token
  First Digital USD
  Aptos
Aptos  Hedera
  Filecoin
  Stellar
  Cosmos Hub
  Render
  Pepe
Pepe  OKB
OKB  Immutable
  XT.com
  Arbitrum
  Bittensor
  Maker
Maker  Optimism
  dogwifhat
  Wrapped eETH
  The Graph
