
The Bitcoin price prediction indicates sideways movement as the coin fails to head towards the 21-day moving average.
Bitcoin Prediction Statistics Data:
- Bitcoin price now – $21,620
- Bitcoin market cap – $413.1 billion
- Bitcoin circulating supply – 19.0 million
- Bitcoin total supply – 19.0 million
- Bitcoin Coinmarketcap ranking – #1
BTC/USD Long-term Trend: Bearish (Daily Chart)
Key levels:
Resistance Levels: $27,000, $29,000, $31,000
Support Levels: $17,000, $15,000, $13,000
BTC/USD is hovering at $21,620 but the king coin has not been able to reclaim the resistance level of $22,000 as the coin consolidates above the 9-day and 21-day moving averages. At the moment, the Bitcoin price may begin to follow the sideways movement, but the daily chart shows that the formation of a bullish movement is likely to play out.
Bitcoin Price Prediction: BTC Price May Consolidates to the Upside
As the Bitcoin price moves toward the east, it is likely to slide and face the upper boundary of the channel as the technical indicator Relative Strength Index (14) moves in the same direction below the 50-level. This could mean that the King coin is ready for the upside until the red line of the 9-day moving average crosses above the green line of the 21-day moving average.

Looking at it from above, recovery may set in bit by bit as the bulls may bring the king coin above the resistance level of $22,000. However, a sustainable movement towards the north may reach the resistance level of $25,000, which could allow for an extended recovery in the direction of the potential resistance levels at $27,000, $29,000, and $31,000. On the downside, any bearish movement may cause the Bitcoin price to hit the supports at $17,000, $15,000, and $13,000.
BTC/USD Medium-Term Trend: Bullish (4H Chart)
Looking at the 4-hour chart, the Bitcoin price is trading above the 9-day and 21-day moving averages. BTC/USD may cross above the upper boundary of the channel as the market is trying to recover from the bearish momentum. However, if the price is stable above the 9-day moving average and crosses above the upper boundary of the channel, it could locate the resistance level of $23,000 and above.
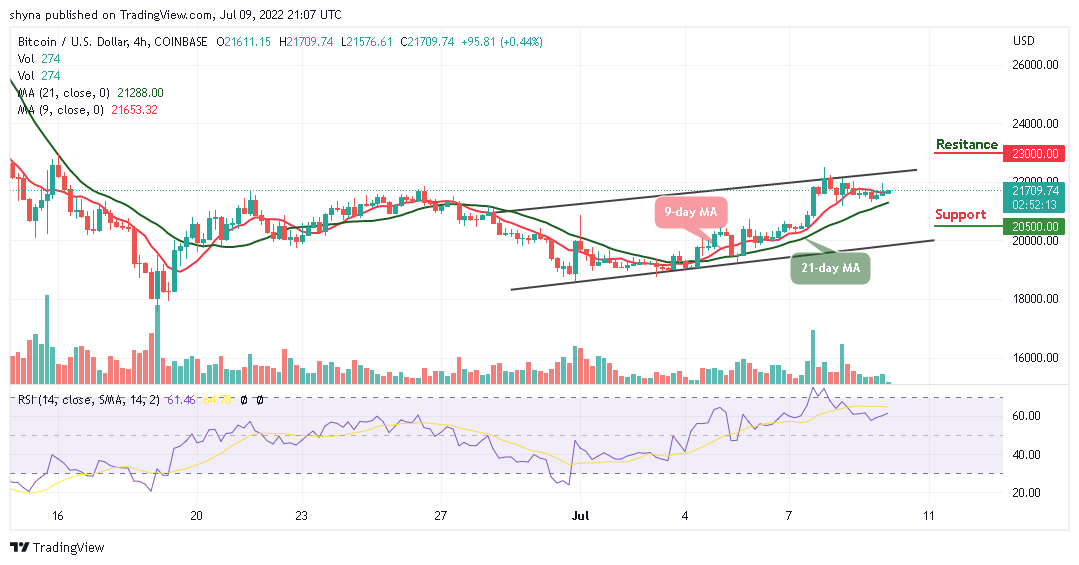
Moreover, if the bearish movement steps back, the support level of $21,000 may not be able to hold the selling pressure. Therefore, BTC/USD is likely to fall to $20,500 and below if the price moves toward the lower boundary of the channel. Nevertheless, the technical indicator Relative Strength Index (14) is moving towards the 70-level to confirm the bullish movement.
eToro – Our Recommended Bitcoin Platform
- Regulated by the FCA, ASIC and CySEC
- Buy Bitcoin with Bank transfer, Credit card, Neteller, Paypal, Skrill
- Free Demo Account, Social Trading Community – 20 Million Users
- Free Bitcoin Wallet – Unlosable Private Key
- Copytrade Winning Bitcoin Traders – 83.7% Average Yearly Profit
68% of retail investor accounts lose money when trading CFDs with this provider.
Read more:
Credit: Source link


 Bitcoin
  Ethereum
  Tether
  BNB
BNB  Solana
  USDC
USDC  XRP
XRP  Dogecoin
  Toncoin
  Cardano
  Shiba Inu
  Avalanche
  Wrapped Bitcoin
  Bitcoin Cash
  Polkadot
  NEAR Protocol
  Polygon
  Litecoin
  Uniswap
  LEO Token
  First Digital USD
  Aptos
Aptos  Hedera
  Stellar
  Filecoin
  Cosmos Hub
  OKB
OKB  XT.com
  Immutable
  Pepe
Pepe  Render
  Arbitrum
  Wrapped eETH
  dogwifhat
  Bittensor
  Maker
Maker  Optimism
  Ethena USDe
