
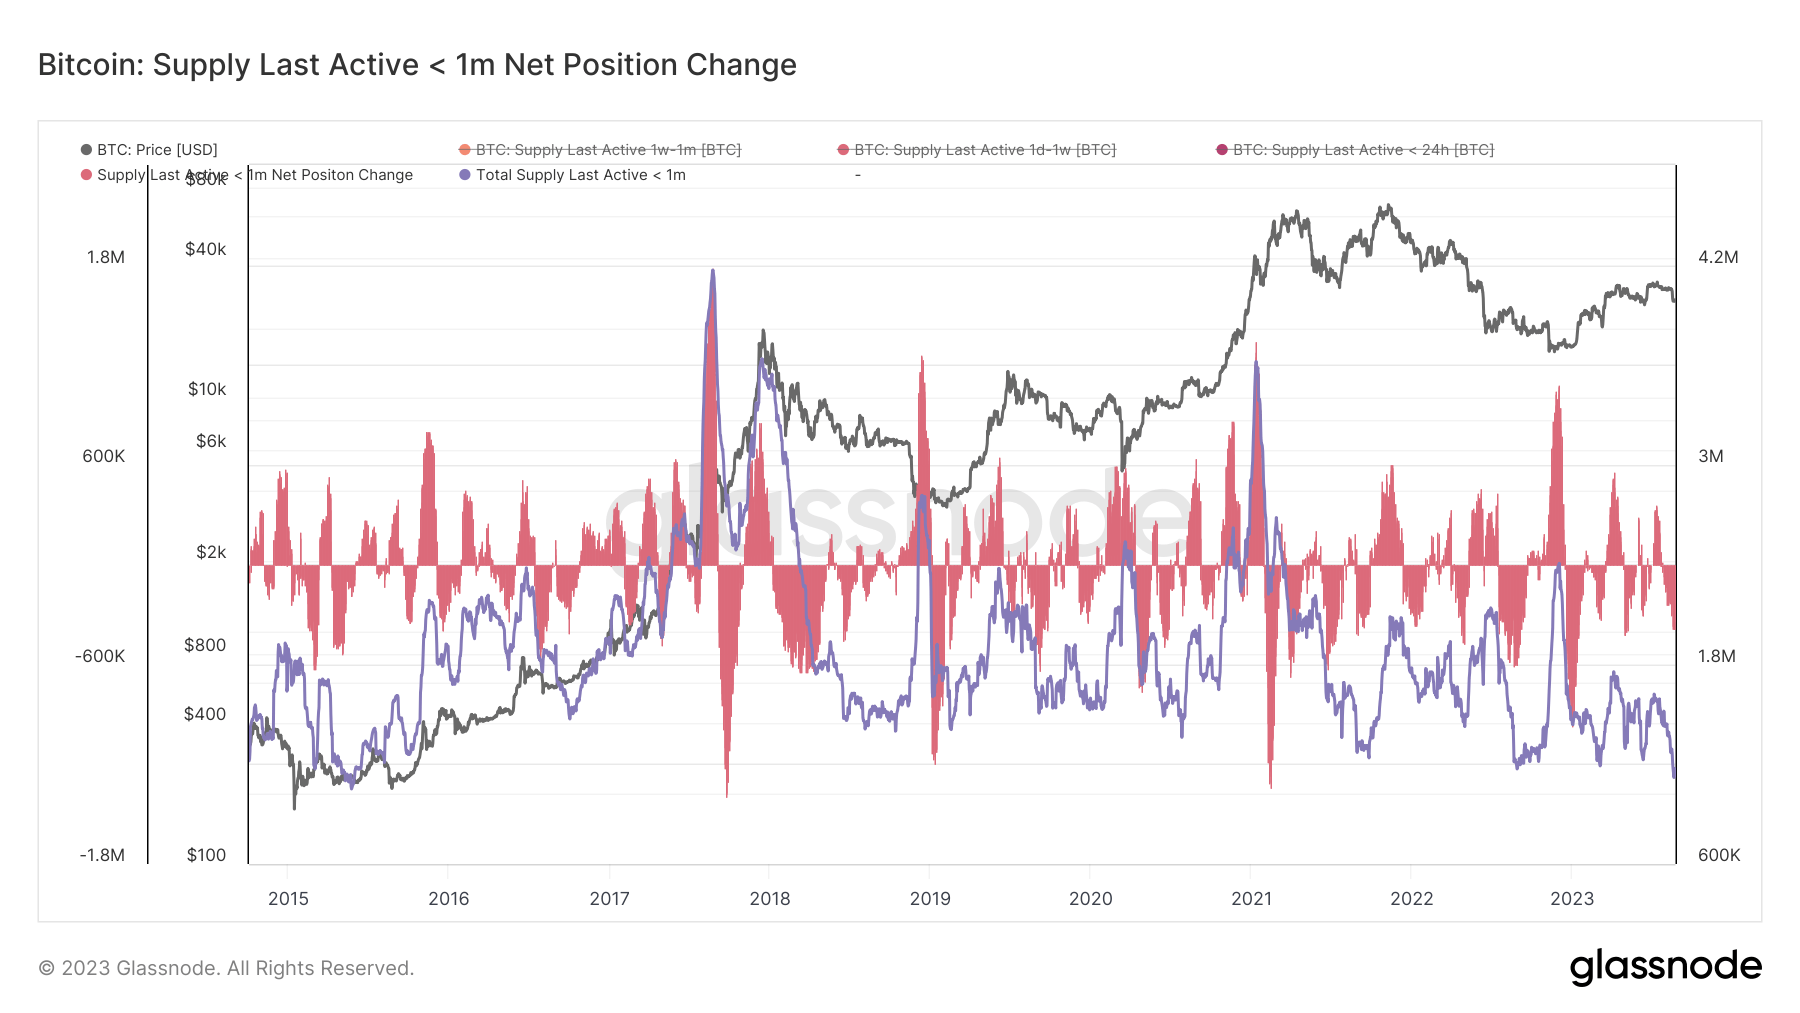
Bitcoin’s supply last active less than a month ago has plummeted to an 8-year low. This often overlooked metric provides essential insights into the market’s current dynamics and is useful when analyzing historical trends.
Bitcoin’s supply dynamics are helpful when analyzing the market, as they provide a window into the trading behavior of its vast user base. Bitcoin’s supply last active less than a month ago has historically been the most volatile part of its supply, representing the majority of day-to-day transaction activity. Its movement, or lack thereof, can be an indicator of broader market trends.
On Aug. 20, the total supply of Bitcoin last active less than a month ago dropped to 1.12 million BTC. This represents a notable decline from the 1.28 million BTC it recorded on Aug. 14. During that time, Bitcoin’s price dropped from $29,400 to $26,200.
The rapid decline culminated in the supply reaching its lowest point in 8 years.
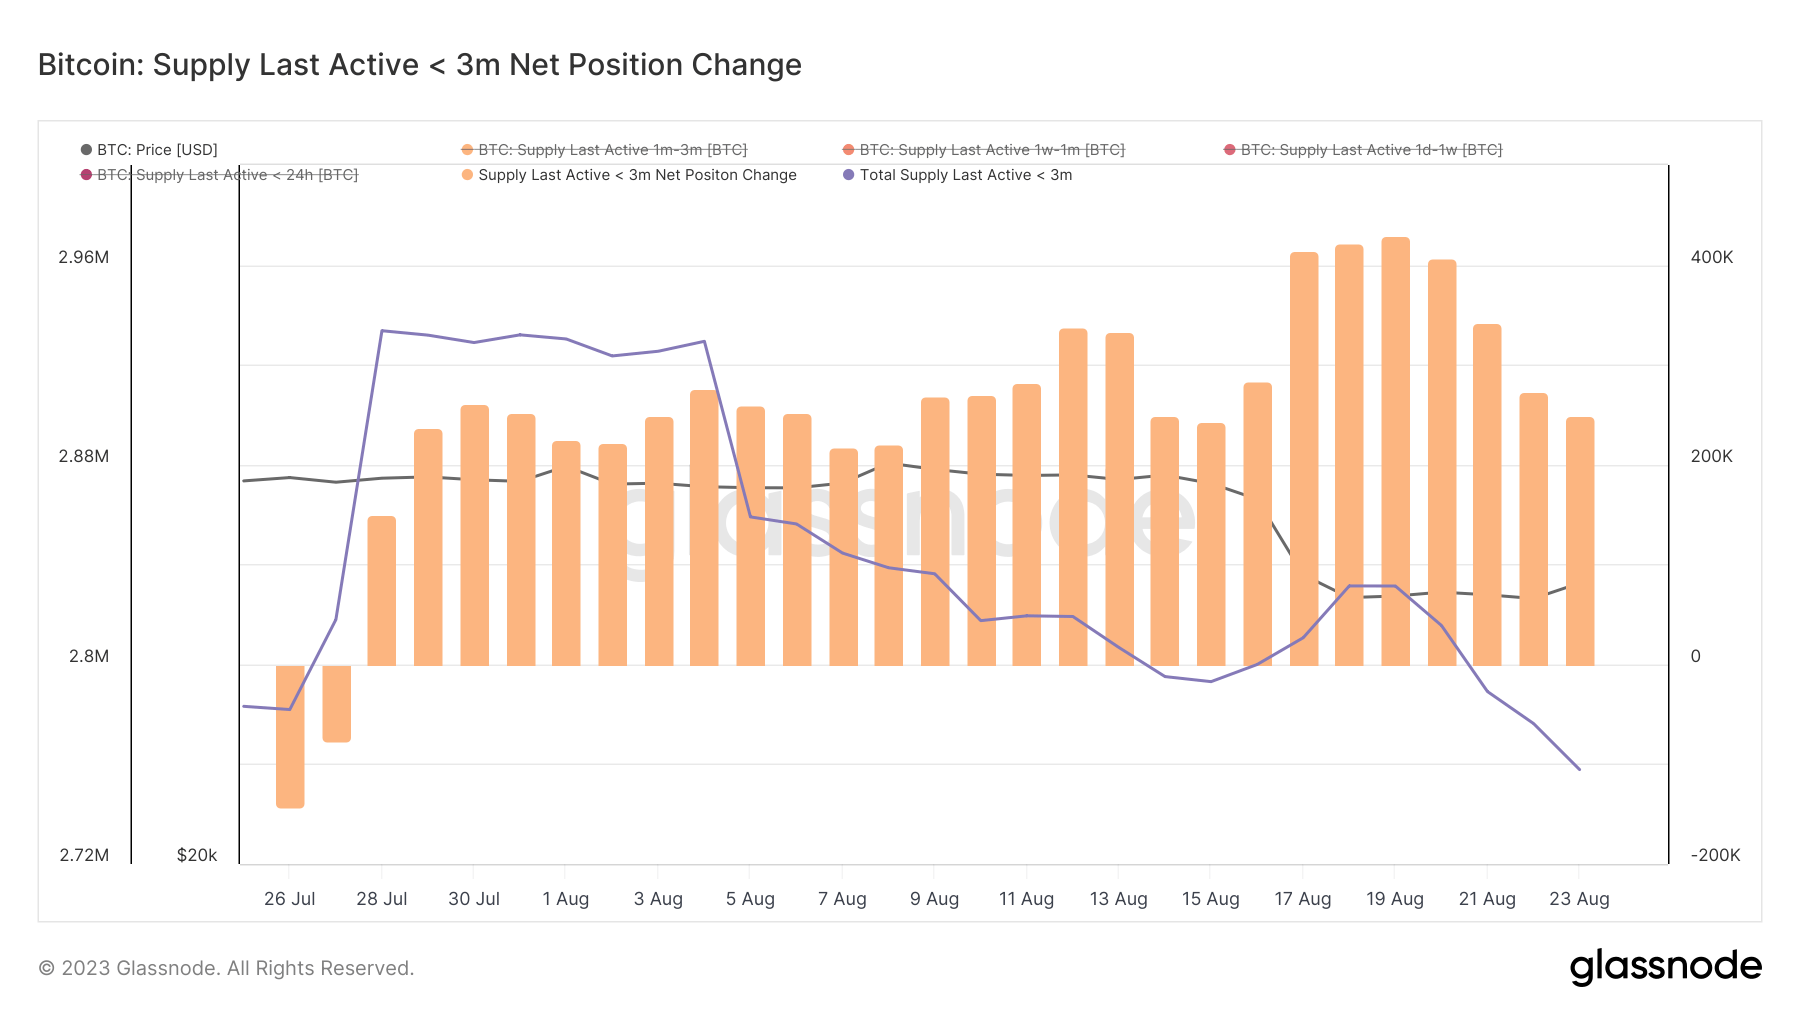
Data from Glassnode further revealed that the supply last active less than 3 months ago also experienced a slight dip, moving from 2.79 million BTC on August 14th to 2.75 million BTC by August 23rd.
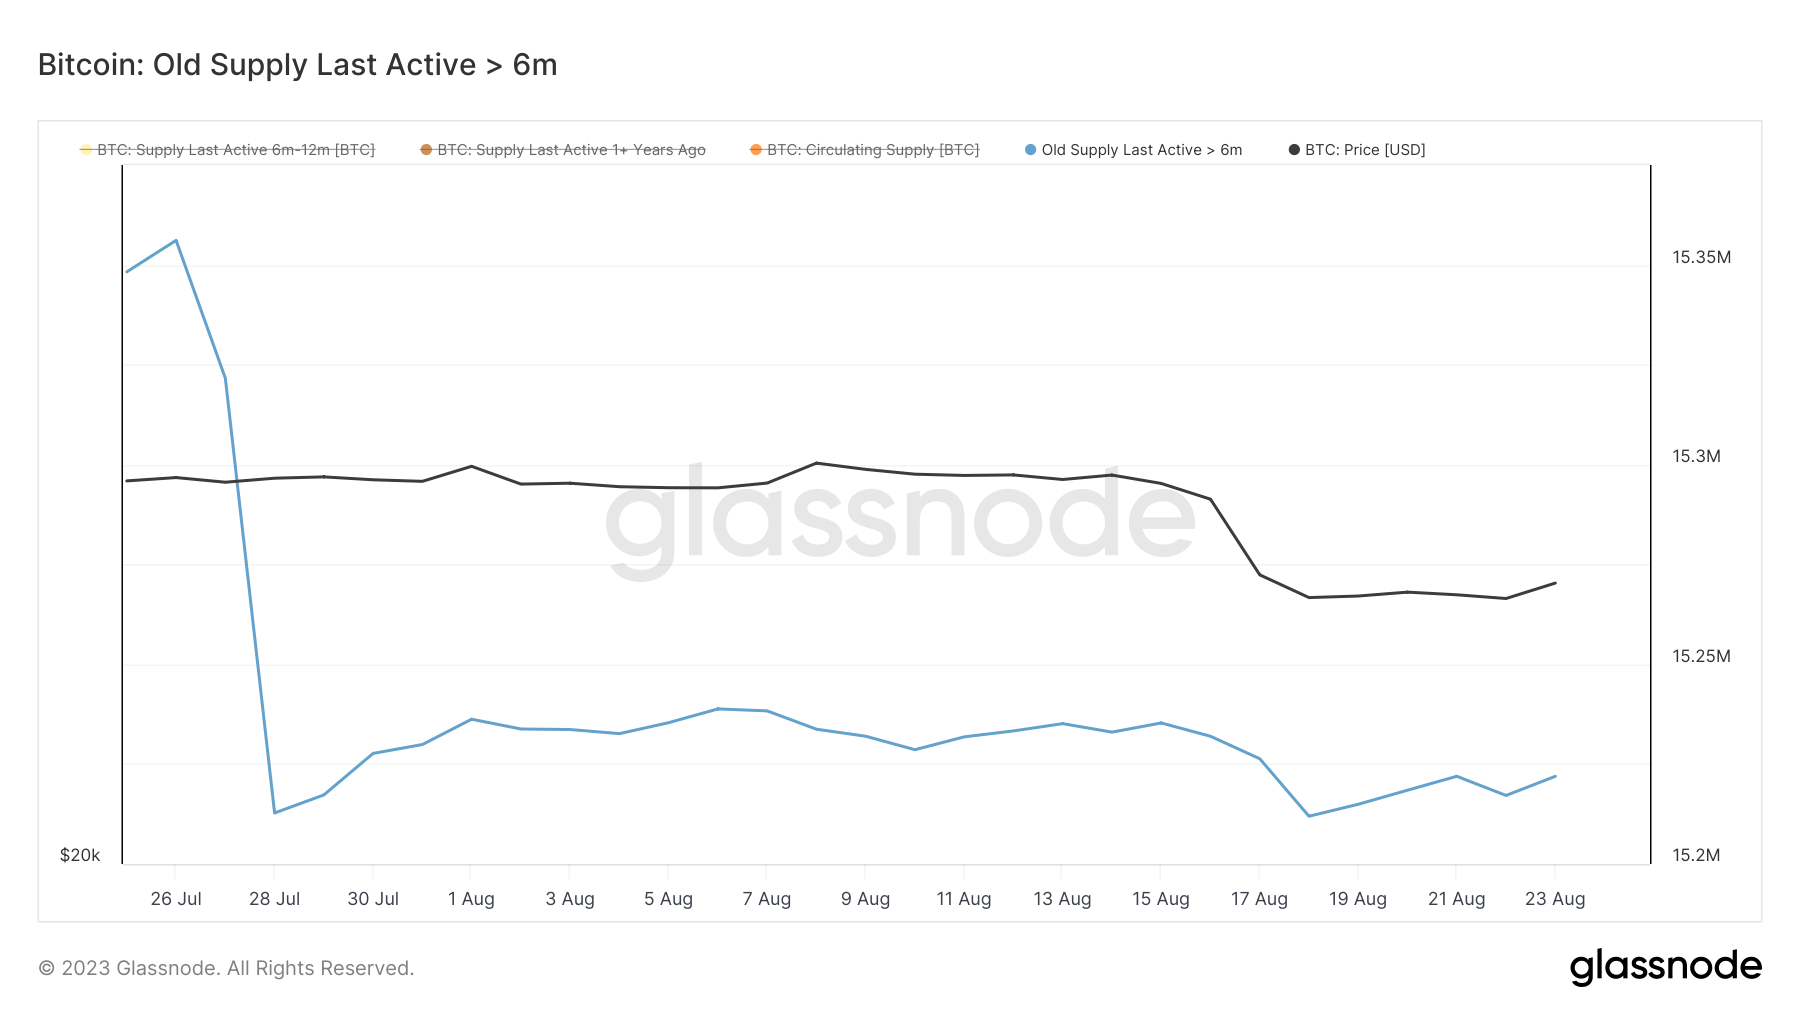
Interestingly, the supply last active more than 6 months ago remained relatively stable, even as Bitcoin’s price faced a slump. This stability in the longer-term active supply suggests that while short-term traders might be adjusting their positions, long-term holders remain unfazed by the price fluctuations.
The significant decrease in “hot coins” points to a decrease in day-to-day trading activity. Fewer coins moving suggests that traders and investors are moving from actively transacting with BTC to holding the coins.
In 2023, the market has seen a clear correlation between the decrease in the supply of these hot coins and drops in Bitcoin’s price. Conversely, an increase in this supply often correlated with an increase in Bitcoin’s price.
The current trend of decreased Bitcoin activity could be interpreted in several ways. It might suggest a stabilization in the market, with fewer participants actively trading BTC. It could also suggest market stagnation, with potential traders sitting on their BTC awaiting clearer signals before making moves.
However, there have been some anomalies in this trend.
November 2022 saw a break in this correlation during the collapse of FTX. At the time, a sharp surge in hot coins occurred while Bitcoin’s price saw a significant downturn.
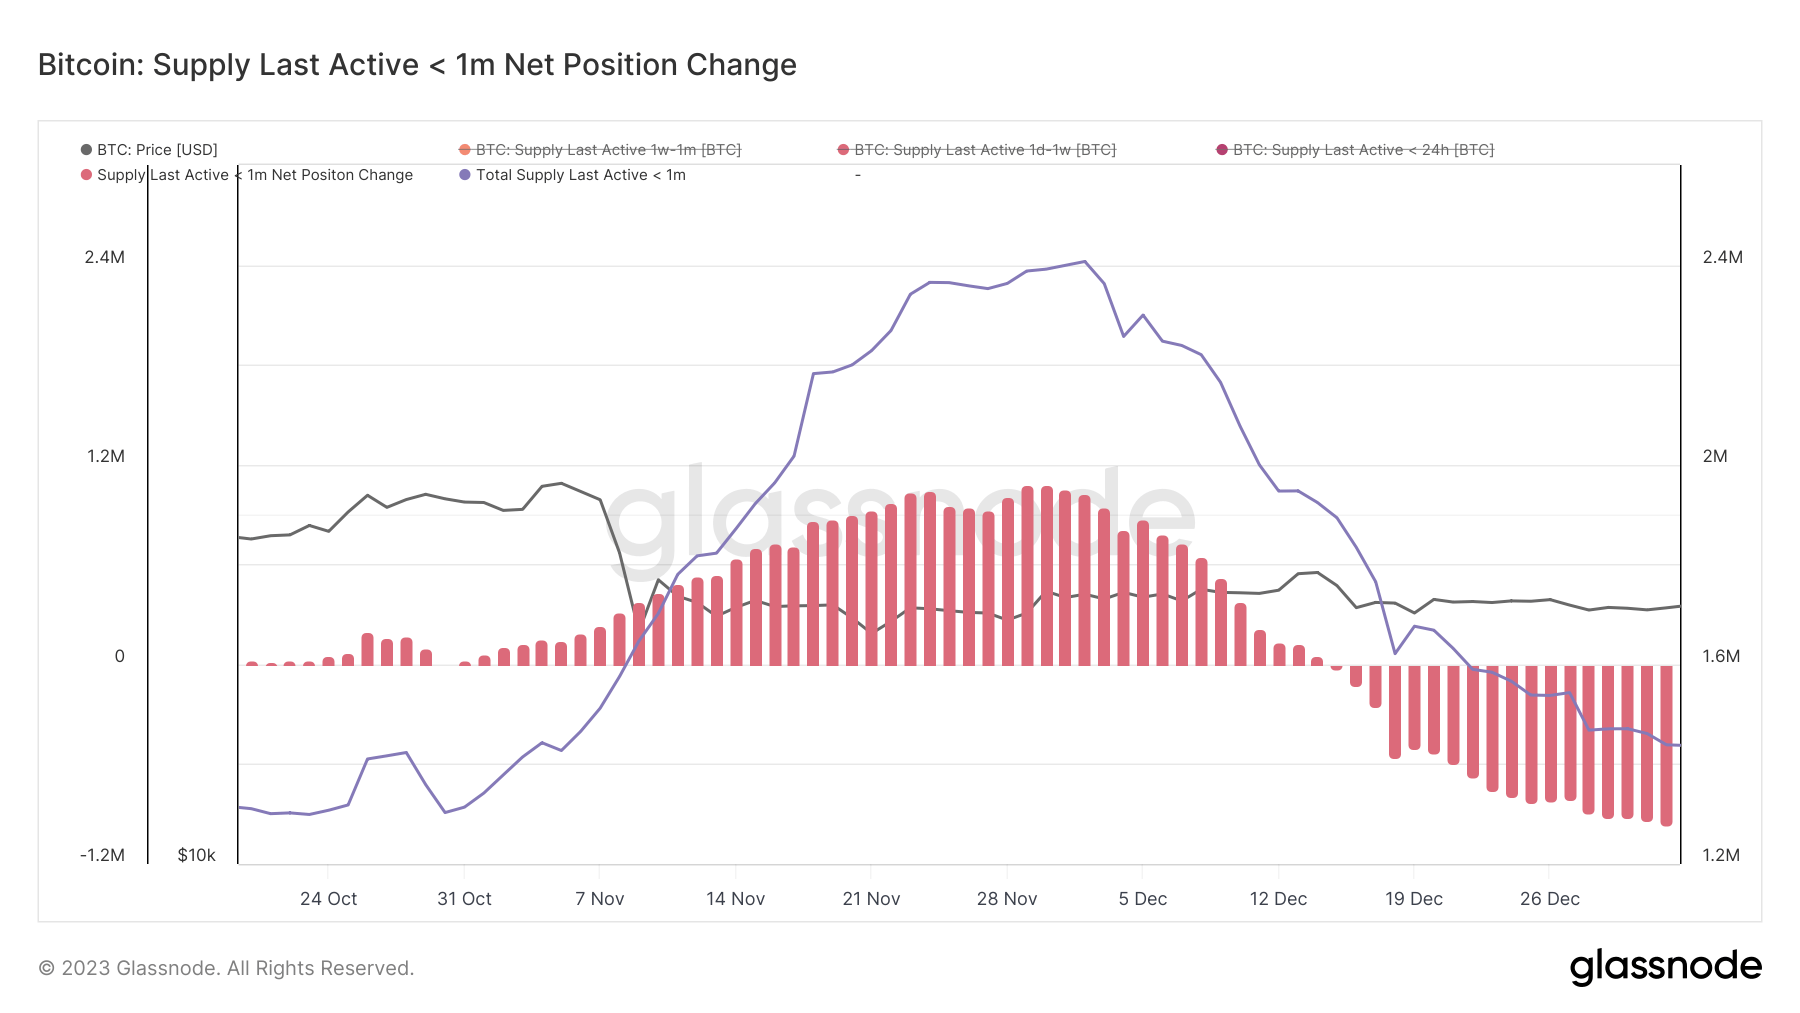
The fact that hot coins surged during this time could indicate panic selling and a rush to move funds out of FTX and related platforms, leading to a sharp spike in activity. As the price continued dropping despite the increase in supply movement, it could indicate a prevailing negative sentiment and lack of confidence in the market at the time.
The post Bitcoin’s most active supply hits 8-year low appeared first on CryptoSlate.
Credit: Source link


 Bitcoin
  Ethereum
  Tether
  BNB
BNB  Solana
  USDC
USDC  XRP
XRP  Dogecoin
  Toncoin
  Cardano
  Shiba Inu
  Avalanche
  Wrapped Bitcoin
  Bitcoin Cash
  Polkadot
  NEAR Protocol
  Polygon
  Litecoin
  Uniswap
  LEO Token
  First Digital USD
  Hedera
  Aptos
Aptos  Stellar
  Cosmos Hub
  Filecoin
  OKB
OKB  Render
  XT.com
  Immutable
  Pepe
Pepe  Bittensor
  Arbitrum
  dogwifhat
  Maker
Maker  Wrapped eETH
  The Graph
  Optimism
