
While Bitcoin’s price saw a substantial increase in the past two weeks, there was a simultaneous decrease in the creation of new addresses and the transaction count on the network.
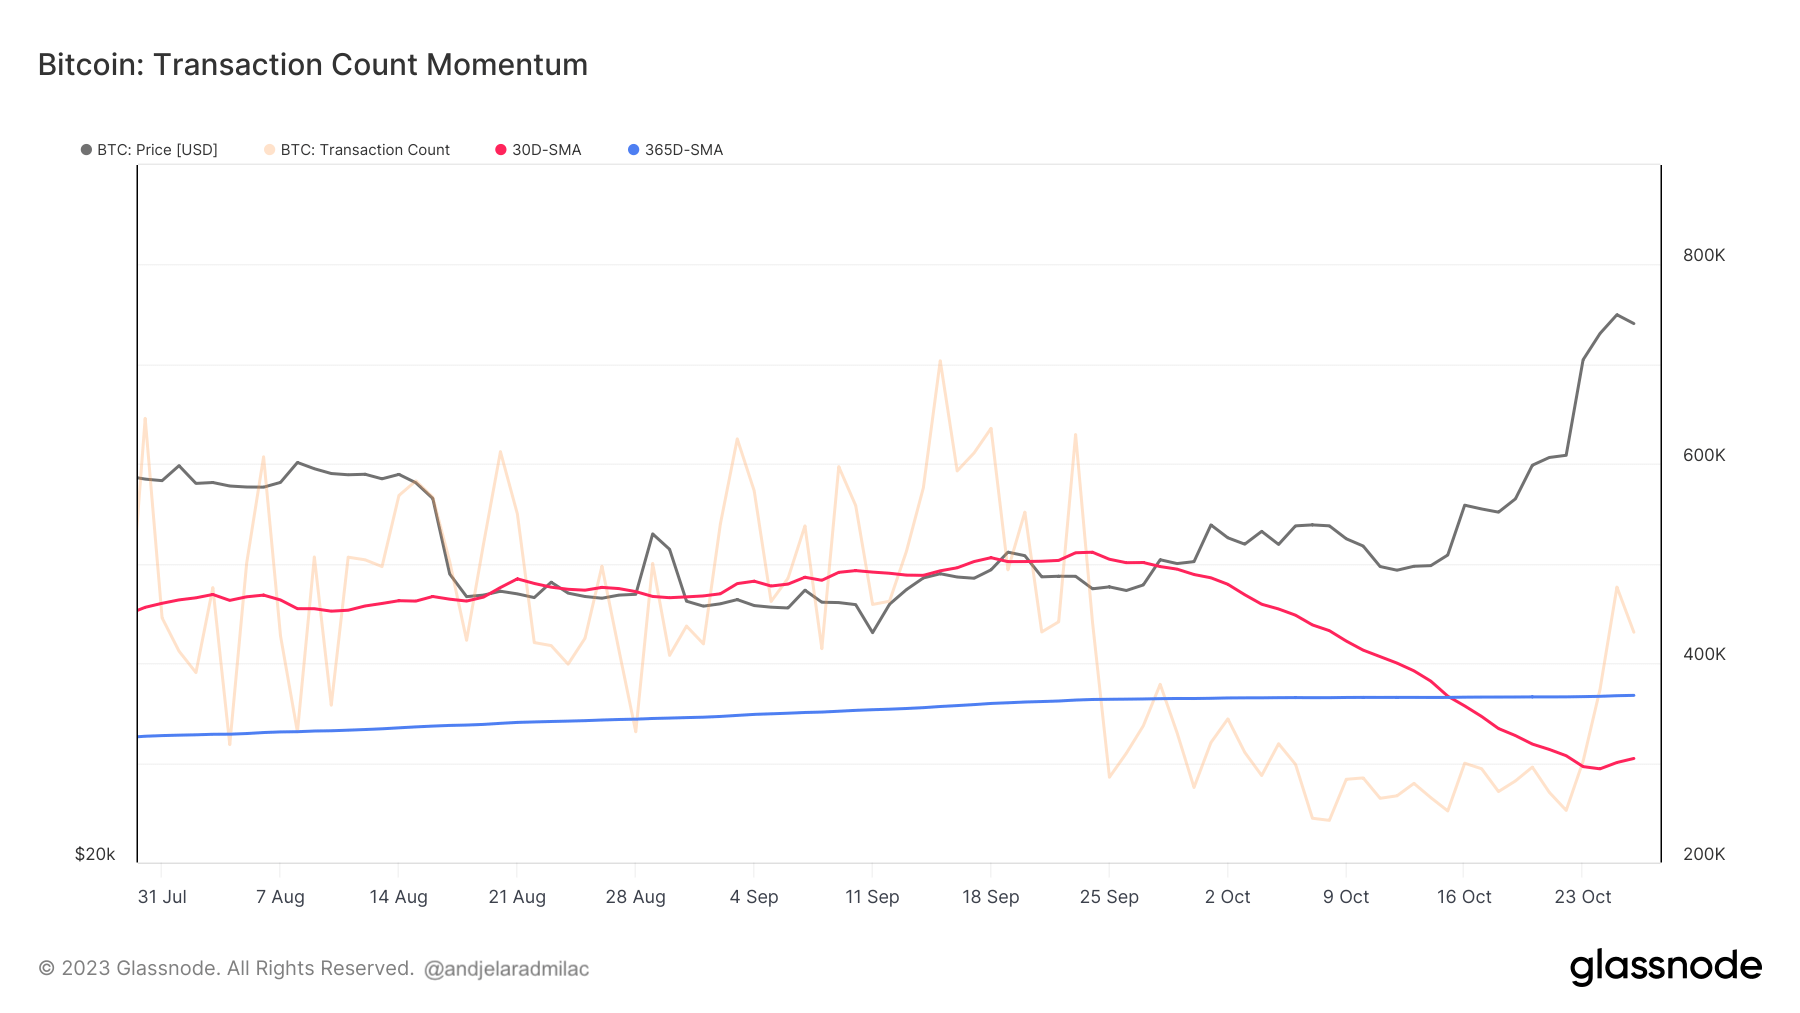
Between Oct. 15 and Oct. 27, Bitcoin’s price surged from $27,140 to $34,160. Historically, such price upticks are accompanied by heightened network activity, as an influx of users engages with the network, either by generating new addresses or initiating transactions. However, in this period, the 30-day Simple Moving Average (SMA) of new addresses and transaction count declined.
Specifically, the 30-day SMA of new addresses dropped from 457,371 to 415,336, and both metrics saw their 30-day SMA fall below their respective 365-day Daily Moving Average (DMA), persisting in that state.
In the crypto market, daily metrics often exhibit significant volatility due to myriad factors, making them less informative when considered in isolation. For instance, daily on-chain activity can be influenced by events such as large transactions by whales, exchange maintenance, or short-term news events. Hence, it’s more insightful to examine moving averages to gain a clearer picture of the underlying trends. The 30-day (monthly) SMA offers a smoothed representation of a month’s worth of data, while the 365-day (yearly) DMA provides a broader perspective, encapsulating a year of activity. By comparing the two, we can identify shifts in the dominant sentiment and infer whether network activity is expanding or contracting relative to historical benchmarks.
The rise in Bitcoin’s price, juxtaposed with the dip in on-chain metrics, suggests that the current price movements may not be underpinned by an equivalent surge in on-chain usage. One potential explanation for this discrepancy is the role of speculative activity. The upward price trajectory could be fueled more by speculative trades on exchanges rather than genuine on-chain use. Since centralized exchanges often handle trades off-chain, a spike in trading volume would not necessarily manifest on the blockchain.
This speculation could be caused by various external influences. Macroeconomic factors, regulatory developments, or news in the broader crypto ecosystem might drive the price, independent of Bitcoin’s on-chain metrics. This dynamic suggests that Bitcoin’s value is influenced by a broader set of factors beyond its network activity.
Additionally, the reduced on-chain activity might indicate a behavioral shift among Bitcoin users. Existing users might be retaining their Bitcoin, hodling in anticipation of future appreciation. This signifies a long-term belief in Bitcoin’s value proposition and an evolving perspective on its role in portfolios.
Lastly, technological developments could also be contributing to the observed trend. The proliferation of second-layer solutions or sidechains, like the Lightning Network, could result in fewer on-chain transactions. These platforms enable transaction aggregation off-chain, reflecting a shift in how transactions are conducted but not necessarily a reduction in overall Bitcoin activity.
The post Bitcoin’s price surge not reflected by on-chain activity appeared first on CryptoSlate.
Credit: Source link


 could rally by nearly 25% after a period of price consolidation")


, Theta Network (THETA), and Parody Coin (PARO)")


 Bitcoin
  Ethereum
  Tether
  BNB
BNB  Solana
  USDC
USDC  XRP
XRP  Dogecoin
  Toncoin
  Cardano
  Shiba Inu
  Avalanche
  Wrapped Bitcoin
  Bitcoin Cash
  Polkadot
  NEAR Protocol
  Polygon
  Litecoin
  Uniswap
  LEO Token
  First Digital USD
  Aptos
Aptos  Hedera
  Stellar
  Filecoin
  Cosmos Hub
  OKB
OKB  Render
  XT.com
  Immutable
  Pepe
Pepe  Arbitrum
  Maker
Maker  Bittensor
  Optimism
  Wrapped eETH
  dogwifhat
  The Graph
