
The Bitcoin price prediction reveals that BTC may break out of the current short-term pattern and move towards the $32,000 level.
Bitcoin Prediction Statistics Data:
- Bitcoin price now – $29,720
- Bitcoin market cap – $567.5 billion
- Bitcoin circulating supply – 19.0 million
- Bitcoin total supply – 19.0 million
- Bitcoin Coinmarketcap ranking – #1
BTC/USD Long-term Trend: Bearish (Daily Chart)
Key levels:
Resistance Levels: $35,000, $37,000, $39,000
Support Levels: $25,000, $23,000, $21,000
BTC/USD is at the moment trading at $29,720 with a 0.17% gain since the beginning of today’s trading. Looking at the daily chart, the Bitcoin price could struggle to stay above the 9-day and 21-day moving averages. More so, for BTC/USD to remain above this barrier, it could make many traders feel that the $29,000 support level could be pretty strong.
Bitcoin Price Prediction: Would BTC Price Break Higher
The Bitcoin price could not drop much the cause of today’s trading, but if the first digital coin breaks below the support level of $29,000, it could change the direction of the coin to face the lower boundary of the channel. Alternatively, Bitcoin (BTC) may reclaim the previous resistance level of $32,000 to head to the upside. If successful, BTC/USD could aim at the resistance levels of $35,000, $37,000, and $39,000 respectively.

Nevertheless, the technical indicator Relative Strength Index (14) is moving below 50-level as the coin may consolidate around this level. Moreover, this could mean that there may still be a room that could be explored by the bears if it crosses below 40-level. Therefore, the support levels of $25,000, $23,000, and $21,000 may play out.
BTC/USD Medium-Term Trend: Ranging (4H Chart)
From a technical point of view, on the 4-hour chart, the technical indicator Relative Strength Index (14) is now recovering towards the 50-level, and this may confirm the bullish movement if it crosses above it. Meanwhile, adding to the above, there is a little bit of bullish divergence on the RSI (14) as the coin crosses above the 9-day moving average to continue the bullish movement.
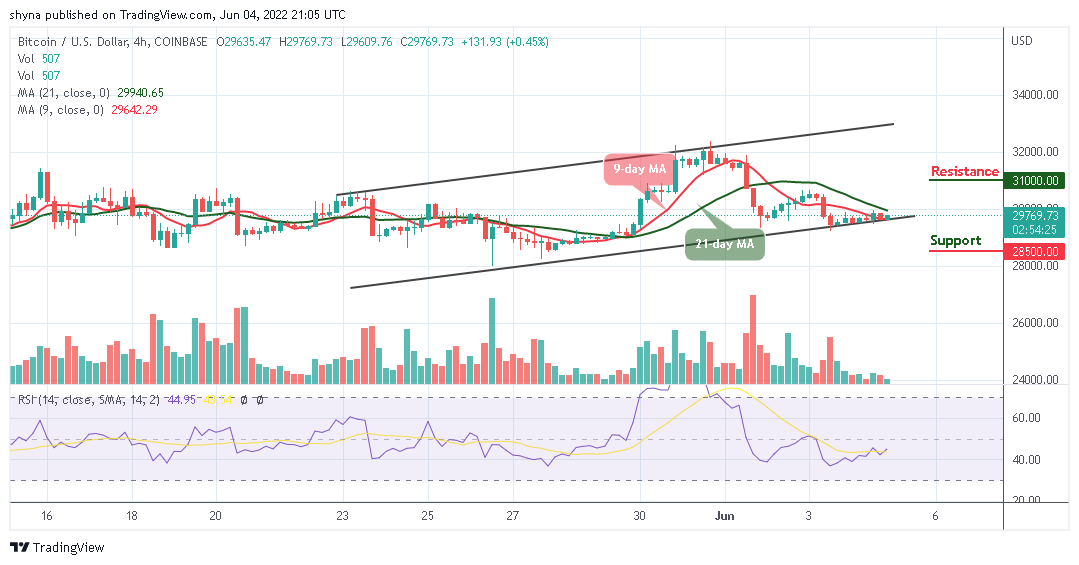
However, if the Bitcoin price breaks below the lower boundary of the channel, the market price may likely reach support at $28,500 and below. Meanwhile, if the current market value rises and crosses above the 21-day moving average, it may reach the resistance level at $31,000 and above.
Try Bitcoin Profit, the most popular auto trader in 2020!

- 92% Claimed win-rate
- $/£ 250 Min Deposit
- Accepts Debit and Credit Card
Read more:
Credit: Source link


 Bitcoin
  Ethereum
  Tether
  BNB
BNB  Solana
  USDC
USDC  XRP
XRP  Dogecoin
  Toncoin
  Cardano
  Shiba Inu
  Avalanche
  Polkadot
  Wrapped Bitcoin
  Bitcoin Cash
  Polygon
  NEAR Protocol
  Litecoin
  LEO Token
  Uniswap
  First Digital USD
  Aptos
Aptos  Hedera
  Cosmos Hub
  Pepe
Pepe  Stellar
  Filecoin
  Immutable
  Render
  XT.com
  OKB
OKB  Optimism
  dogwifhat
  Arbitrum
  Bittensor
  Sui
Sui  Wrapped eETH
  Maker
Maker 
