
The Bitcoin price prediction reveals that BTC is yet to gain strength above the moving averages as the coin shows a few bearish signs.
BTC/USD Long-term Trend: Ranging (Daily Chart)
Key levels:
Resistance Levels: $44,000, $46,000, $48,000
Support Levels: $35,000, $33,000, $31,000
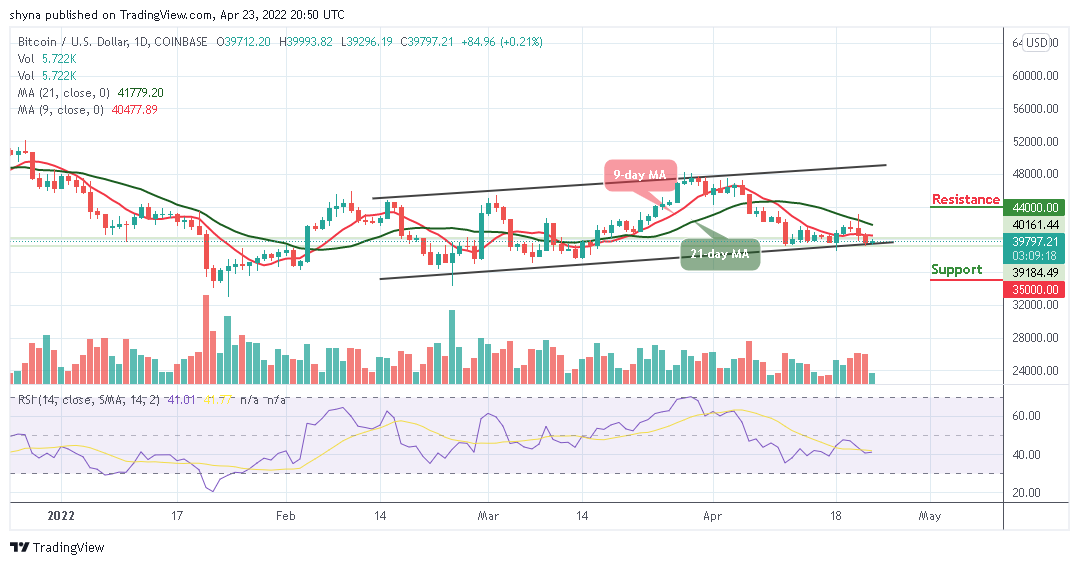
After another failure to clear the $40,000 resistance, BTC/USD remains below the 9-day and 21-day moving averages, and it could begin another decline if bulls failed to push it above the moving averages. At the opening of today’s trading; the touches the resistance level of $39,993, but any further bearish movement may keep the coin within the bearish zone.
Bitcoin Price Prediction: Would Bitcoin (BTC) Head to Downside?
As the Bitcoin price moves under the moving averages, crossing below the lower boundary of the channel may begin to show bearish signs below the $39,000 and $38,000 levels. More so, if there are more losses, the price could break the major supports at $35,000, $34,000, and $32,000. Meanwhile, the technical indicator Relative Strength Index (14) is likely to move below the 40-level to increase the bearish movement.
On the other hand, if the king coin crosses above the 9-day and 21-day moving averages; it could begin a bullish movement. Moreover, the main resistance could be located around the $40,000 level and a clear break above this level may push the price towards the resistance levels of $44,000, $46,000, and $48,000.

BTC/USD Medium-Term Trend: Ranging (4H Chart)
According to the 4-hour chart, the coin may gain the lost momentum to hit the trade above $40,000, but at the moment, the selling pressure still exists, and this may not allow the coin to cross above the 9-day and 21-day moving averages. Meanwhile, the $38,000 and below may come into play if BTC moves toward the lower boundary of the channel.
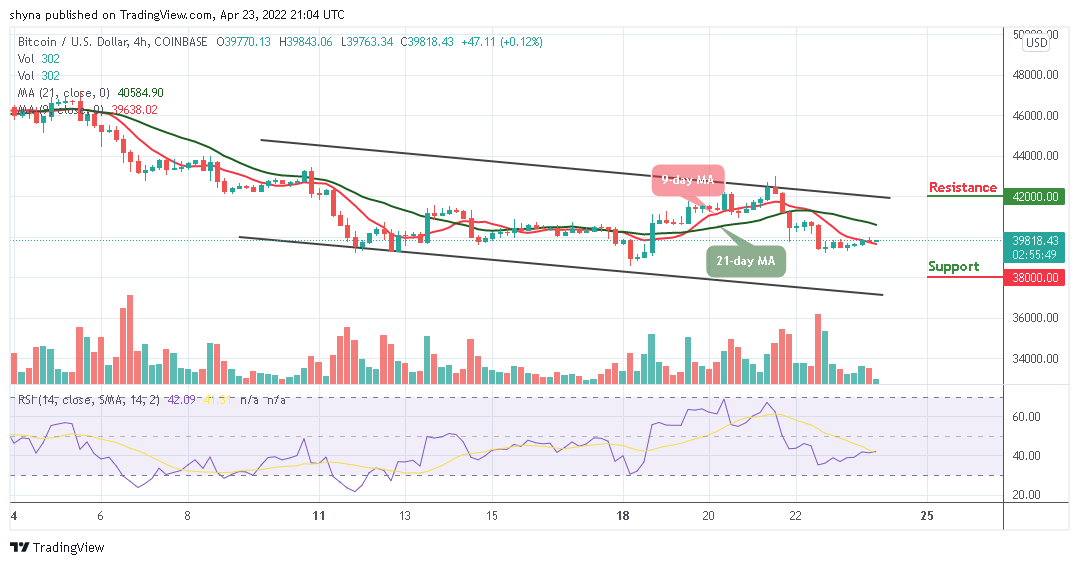
However, if the buyers power the market, traders can expect a retest at the $40,000 level, and breaking this level may further allow the bulls to reach the resistance level of $42,000 and above. The Relative Strength Index (14) moves above the 40-level which shows that more bullish signals may continue to play out.
Looking to buy or trade Bitcoin (BTC) now? Invest at eToro!
68% of retail investor accounts lose money when trading CFDs with this provider
Credit: Source link


 Can Reach a New ATH This Month")


 Bitcoin
  Ethereum
  Tether
  BNB
BNB  Solana
  USDC
USDC  XRP
XRP  Dogecoin
  Toncoin
  Cardano
  Shiba Inu
  Avalanche
  Wrapped Bitcoin
  Polkadot
  Bitcoin Cash
  NEAR Protocol
  Polygon
  Litecoin
  Uniswap
  Fetch.ai
  LEO Token
  Aptos
Aptos  Hedera
  First Digital USD
  Pepe
Pepe  Cosmos Hub
  dogwifhat
  Render
  Filecoin
  Stellar
  Immutable
  XT.com
  Optimism
  OKB
OKB  Bittensor
  Arbitrum
  Wrapped eETH
  Maker
Maker  The Graph
