
Bitcoin Price Prediction – January 3
The Bitcoin price prediction shows that BTC keeps trading below the moving averages as the coin touches at $46,276 support.
BTC/USD Long-term Trend: Bearish (Daily Chart)
Key levels:
Resistance Levels: $50,000, $52,000 $54,000
Support Levels: $43,500, $41,500, $39,500
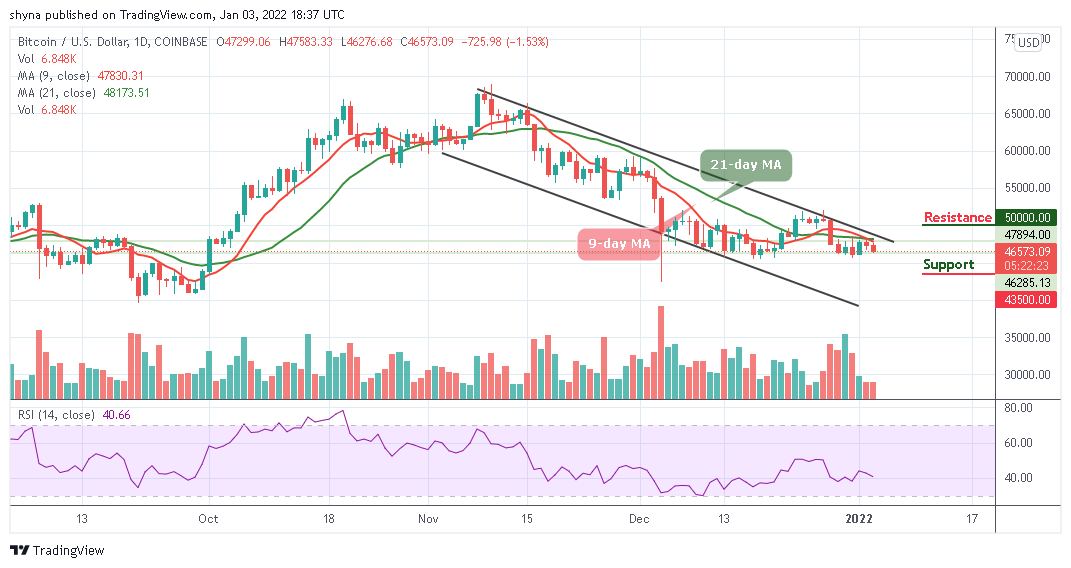
BTCUSD – Daily Chart
BTC/USD is currently facing a setback as this could be a permanent one. The king coin is likely to have a bearish run in the short-term but a price rally may help the coin to head to the south as the red line of the 9-day moving average is crossing below the green line of the 21-day moving average. Currently, Bitcoin (BTC) is trading around $46,573 level after a free fall from $47,299 during the European session and the coin has shown tremendous volatility over the past few days.
Bitcoin Price Prediction: Bitcoin (BTC) May Head Below the Moving Averages
Looking at the daily chart, the Bitcoin price is currently nose-diving below the 9-day and 21-day moving averages. If the price should slump below the support level of $46,000, the king coin is likely to face the downward trend. However, further bearish movement could locate the supports at $43,500, $41,500, and $39,500, making room for BTC to fall even further.
In the meantime, the technical indicator Relative Strength Index (14) is likely to cross below 40-level as trading volume could be in support of the bears. Moreover, if the bulls decide to move the price above the 9-day and 21-day moving average, BTC/USD may likely cross above the upper boundary of the channel to locate the resistance levels at $50,000, $52,000, and $54,000.

BTC/USD Medium-Term Trend: Bearish (4H Chart)
On the 4-Hour chart, the Bitcoin price stays below the 9-day and 21-day moving averages and the immediate support is likely to come at $45,500 level. The price may likely fall below this level if the bears fully stepped back into the market.

BTCUSD – 4 Hour Chart
However, a further bearish movement could test the critical support at the $45,000 level and below while the resistance is located above the moving averages at the resistance level of $48,000 and above. Technically, Bitcoin is currently moving into the negative side as the technical indicator Relative Strength Index (14) is likely to cross below 40-level.
Looking to buy or trade Bitcoin (BTC) now? Invest at eToro!
68% of retail investor accounts lose money when trading CFDs with this provider
Read more:
Credit: Source link


 to its Platform: A New Meme Coin on Solana")


 Bitcoin
  Ethereum
  Tether
  BNB
BNB  Solana
  USDC
USDC  XRP
XRP  Dogecoin
  Toncoin
  Cardano
  Shiba Inu
  Avalanche
  Wrapped Bitcoin
  Polkadot
  Bitcoin Cash
  NEAR Protocol
  Polygon
  Litecoin
  LEO Token
  Uniswap
  First Digital USD
  Aptos
Aptos  Hedera
  Cosmos Hub
  Stellar
  Filecoin
  OKB
OKB  XT.com
  Immutable
  Render
  Arbitrum
  Optimism
  Pepe
Pepe  Sui
Sui  Wrapped eETH
  Maker
Maker  Bittensor
  dogwifhat
