
Bitcoin Price Prediction – December 8
The Bitcoin price prediction is recovering from the recent low of $48,650 but bulls may have trouble taking the market price above $52,000.
BTC/USD Long-term Trend: Ranging (Daily Chart)
Key levels:
Resistance Levels: $55,000, $57,000, $59,000
Support Levels: $45,000, $43,000, $41,000
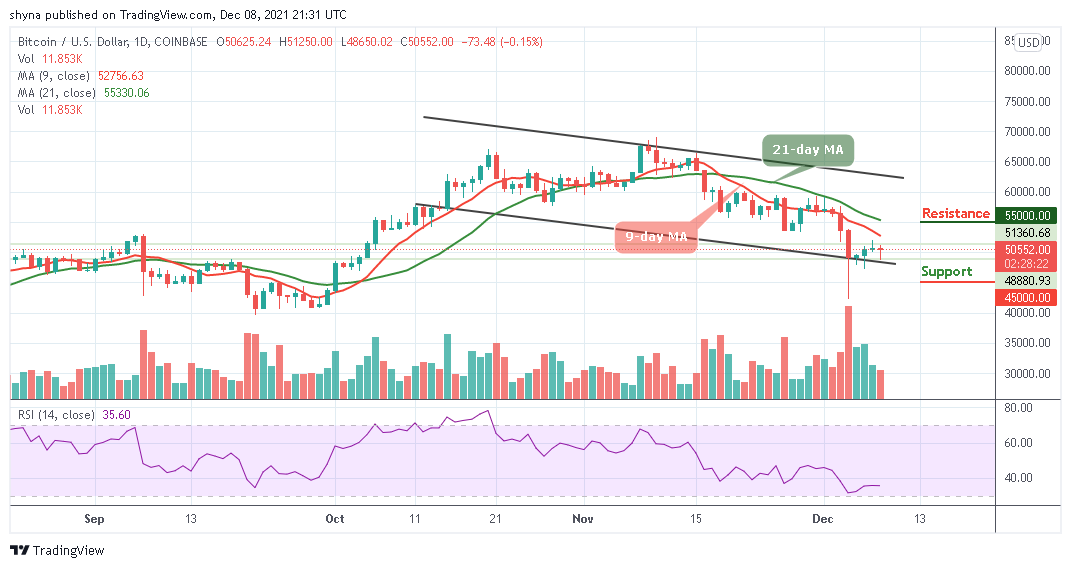
At the time of writing, BTC/USD is trading down by 0.15% at its current price of $50,552. This is the spot where the coin has been trading for the past few days, with the selling pressure seen in the $50,000 region proving significant. Moreover, where the coin may go next could depend on whether or not bulls can take control of it before it breaks below $50,000 or $48,000.
Bitcoin Price Prediction: Bitcoin (BTC) May Recover Above $52k
On the upside, the Bitcoin price is likely to face sellers near the $48,000 zone. A clear close below the lower boundary of the channel could most likely start a strong selling pressure. Meanwhile, the next target for the bulls could be $52,000 in the near term. Any more gains could lead the price towards the $55,000, $57,000, and $59,000 resistance levels.

However, if Bitcoin fails to clear the $51,000 resistance, it could correct lower. The first key support could be located around the $48,000 level. The main support is near the trend line and $46,000. Any more losses might call for a test of the $45,000 support level. If the bulls fail to defend the $43,000 support zone, the price is likely to dive towards the $41,000 support in the coming sessions.
BTC/USD Medium-Term Trend: Ranging (4H Chart)
On the 4-Hour chart, BTC price hovers around $50,641 and may take time to persistently trade above $51,000. However, if the bulls gather enough strength and regroup, the upward movement may be able to cross above the upper boundary of the channel to hit the $54,000 resistance level.
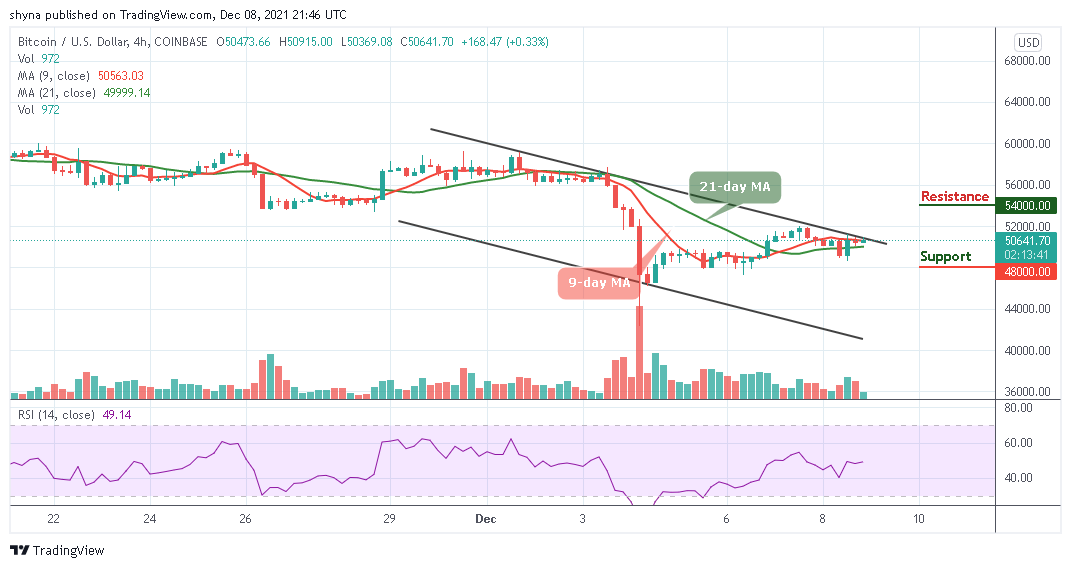
On the downside, immediate support is below the 9-day and 21-day moving averages while the main support is at the $49,000 level. The price may likely fall below $48,000 if the bears step back into the market, a further movement could test the critical support at the $46,000 level. Technically, Bitcoin is currently moving in sideways as the technical indicator Relative Strength Index (14) moves around 50-level, indicating that the market may follow the bullish movement.
Looking to buy or trade Bitcoin (BTC) now? Invest at eToro!
68% of retail investor accounts lose money when trading CFDs with this provider
Credit: Source link


 Grinds 15% Higher Amid Sustained Buying")


 Bitcoin
  Ethereum
  Tether
  BNB
BNB  Solana
  USDC
USDC  XRP
XRP  Dogecoin
  Toncoin
  Cardano
  Avalanche
  Shiba Inu
  Wrapped Bitcoin
  Polkadot
  Bitcoin Cash
  NEAR Protocol
  Polygon
  Litecoin
  Fetch.ai
  Uniswap
  LEO Token
  Hedera
  Aptos
Aptos  First Digital USD
  Render
  Cosmos Hub
  Pepe
Pepe  Filecoin
  dogwifhat
  Immutable
  Stellar
  Wrapped eETH
  XT.com
  Bittensor
  OKB
OKB  Optimism
  Arbitrum
  The Graph
  Maker
Maker 
