
Bitcoin Price Prediction – December 6
According to the daily chart, the Bitcoin price prediction fails at breaching the milestone as the price drops below $50,000 support.
BTC/USD Long-term Trend: Bearish (Daily Chart)
Key levels:
Resistance Levels: $55,000, $57,000, $59,000
Support Levels: $43,000, $41,000, $39,000
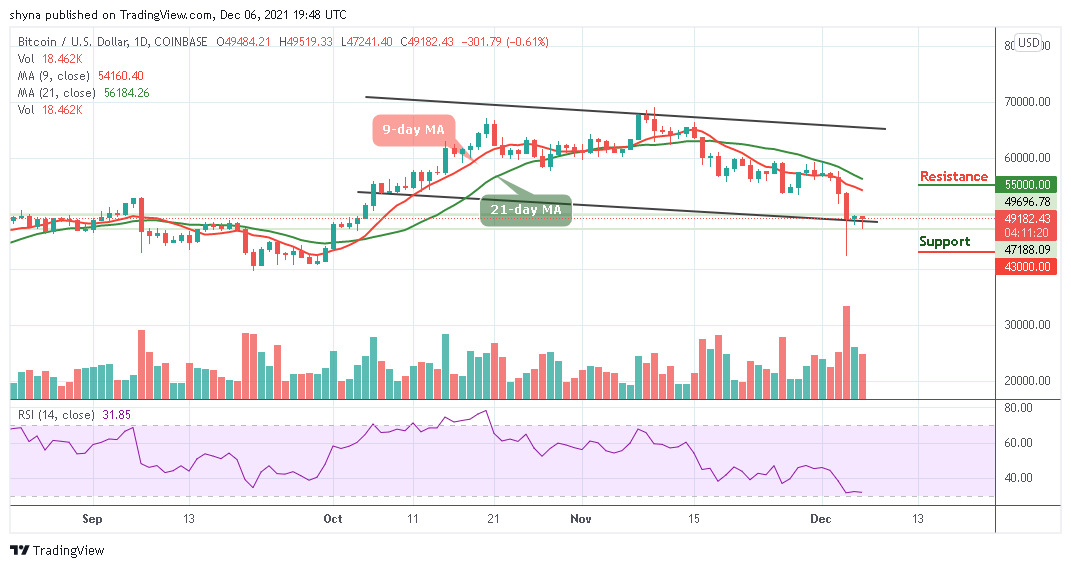
For the past few days, BTC/USD remained relatively stagnant, just beneath the $50,000 price tag as king coin even attempted a few breakouts above that psychological level but to no avail. However, the latest rejection comes just hours ago and this failure is driving the first digital asset vigorously south as it is losing about $300 of value to an intraday low of beneath $47,241.
Bitcoin Price Prediction: Bitcoin (BTC) May Keep the Downtrend
As Bitcoin price fails to settle above the resistance level of $50,000, it is likely for the coin to start a strong decline if there is a close below the $45,000 support. Meanwhile, if the price remains stable above the $49,000 level, there are chances of a fresh increase in the near term and an initial resistance on the upside is around this same level while the main resistance remains around the $52,000 level.
However, a clear break above the $52,000 level might open the doors for a strong increase in the next positive direction. Therefore, in the stated case, the price could rise towards the resistance levels of $55,000, $57,000, and $59,000. On the other hand, the Relative Strength Index (14) is seen adjusting around the oversold region and any bearish movement below this barrier could see the price reaching the critical supports at $43,000, $41,000, and $39,000 respectively.

BTC/USD Medium – Term Trend: Ranging (4H Chart)
At the opening of the market today, the Bitcoin price is ranging, keeping its price from $49,160 to touch the low of $49,093. Should the price drop below the 9-day moving average and move towards the lower boundary of the channel, it could reach the nearest support at $46,000 and below.
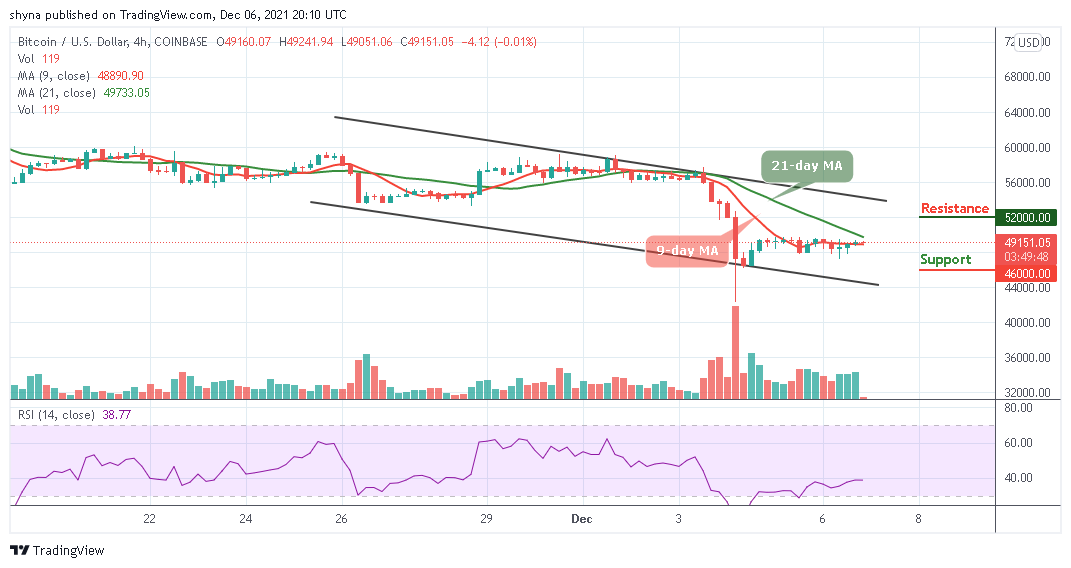
However, if bulls push the coin above the 21-day moving average, the price of Bitcoin may likely reach the potential resistance level of $52,000 and above as the Relative Strength Index (14) moves around 40-level.
Looking to buy or trade Bitcoin (BTC) now? Invest at eToro!
68% of retail investor accounts lose money when trading CFDs with this provider
Read more:
Credit: Source link


")


 Bitcoin
  Ethereum
  Tether
  BNB
BNB  Solana
  USDC
USDC  XRP
XRP  Dogecoin
  Toncoin
  Cardano
  Shiba Inu
  Avalanche
  Wrapped Bitcoin
  Polkadot
  Bitcoin Cash
  NEAR Protocol
  Polygon
  Litecoin
  Uniswap
  Fetch.ai
  LEO Token
  Hedera
  Aptos
Aptos  First Digital USD
  Pepe
Pepe  Cosmos Hub
  dogwifhat
  Filecoin
  Render
  Immutable
  Stellar
  XT.com
  Optimism
  OKB
OKB  Bittensor
  Arbitrum
  Wrapped eETH
  Maker
Maker  The Graph
