
Bitcoin Price Prediction – December 22
The daily chart reveals that the Bitcoin price prediction shows that recovery stalls under $49,000, leaving a gap for sellers to explore.
BTC/USD Long-term Trend: Bearish (Daily Chart)
Key levels:
Resistance Levels: $54,000, $56,000, $58,000
Support Levels: $45,000, $43,000, $41,000
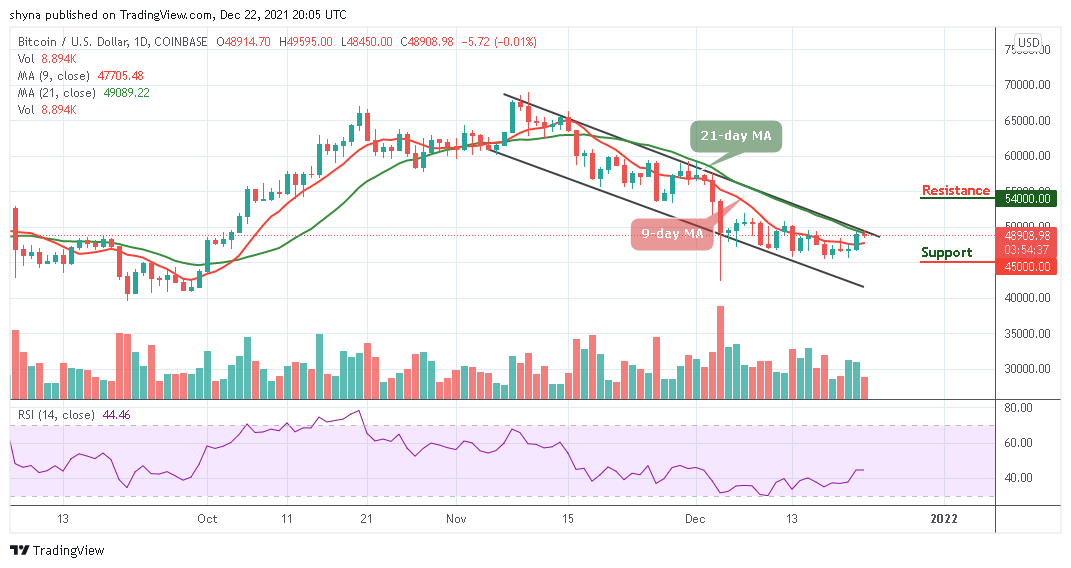
BTCUSD – Daily Chart
Looking to buy or trade Bitcoin (BTC) now? Invest at eToro!
68% of retail investor accounts lose money when trading CFDs with this provider
Looking at the daily chart, Bitcoin bears are likely to take back control as they are seen forcing BTC/USD to bow down to fresh losses. At the time of writing, BTC/USD is changing hands at $48,908 after adjusting lower from $49,595 which is an intraday high. However, the bearish comeback may also break below a short term trend line support. In addition, BTC/USD remains vulnerable to losses if it crosses below the 9-day and 21-day moving averages on the daily chart.
Bitcoin Price Prediction: Bitcoin (BTC) May be Vulnerable to Losses
Looking at the coin from a technical angle, one can say that stability is likely to take over amid signs of consolidation. For example, the technical indicator Relative Strength Index (14) confirms that the market is likely to follow sideways movement. In spite of the possible sideways action in the current session, the Bitcoin price is still under great risk of dropping to levels close to $45,000.

Nonetheless, the bulls are banking on the support at $47,000 and $46,000 to ensure that in spite of a reversal, the Bitcoin price stays above $48,000 level. Any further movement below $46,000 may push the coin towards the critical supports of $45,000, $43,000, and $41,000. Meanwhile, following the upward movement may allow the price to hit the nearest resistance levels at $54,000, $56,000, and $58,000 respectively.
BTC/USD Medium – Term Trend: Ranging (4H Chart)
BTC/USD is seen moving around the 9-day moving average as the 4-hour chart reveals, the king coin is currently follow the sideways movement. However, the support level of $48,000 and below may come into play if the coin focuses on the downward movement.
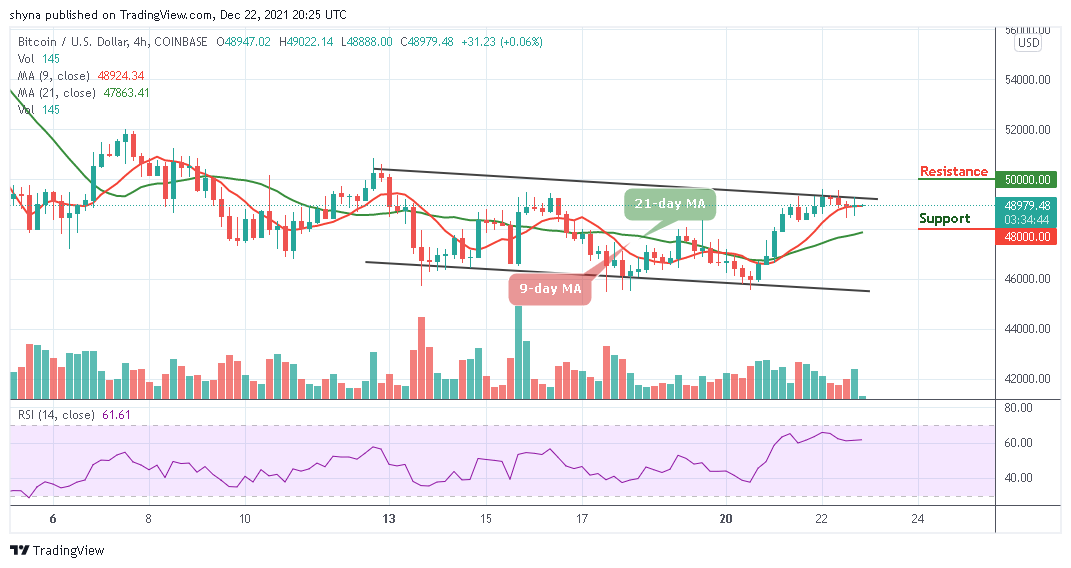
BTCUSD – 4 Hour Chart
Moreover, the bulls may need to regroup and hold the current market value of $48,979, once this is done, traders may expect a retest at $49,000 resistance level and breaking this level may further take BTC/USD to the resistance level of $50,000 and above. The technical indicator Relative Strength Index (14) is moving in the same direction above 60-level, suggesting a sideways movement.
Looking to buy or trade Bitcoin (BTC) now? Invest at eToro!
68% of retail investor accounts lose money when trading CFDs with this provider
Read more:
Credit: Source link

 Letter on Benefits and Challenges for Children in the Metaverse")


 Letter on Benefits and Challenges for Children in the Metaverse")


 Bitcoin
  Ethereum
  Tether
  BNB
BNB  Solana
  USDC
USDC  XRP
XRP  Dogecoin
  Toncoin
  Cardano
  Shiba Inu
  Avalanche
  Wrapped Bitcoin
  Bitcoin Cash
  Polkadot
  NEAR Protocol
  Polygon
  Litecoin
  Uniswap
  LEO Token
  First Digital USD
  Aptos
Aptos  Hedera
  Stellar
  Filecoin
  Cosmos Hub
  OKB
OKB  XT.com
  Render
  Immutable
  Pepe
Pepe  Arbitrum
  Bittensor
  Maker
Maker  Optimism
  Wrapped eETH
  dogwifhat
  The Graph
