
Bitcoin Price Prediction – November 29
The Bitcoin price is trading nicely above the $58,000 and the coin must climb above the $60,000 resistance to continue higher.
BTC/USD Long-term Trend: Bullish (Daily Chart)
Key levels:
Resistance Levels: $64,000, $66,000, $68,000
Support Levels: $53,000, $51,000, $49,000
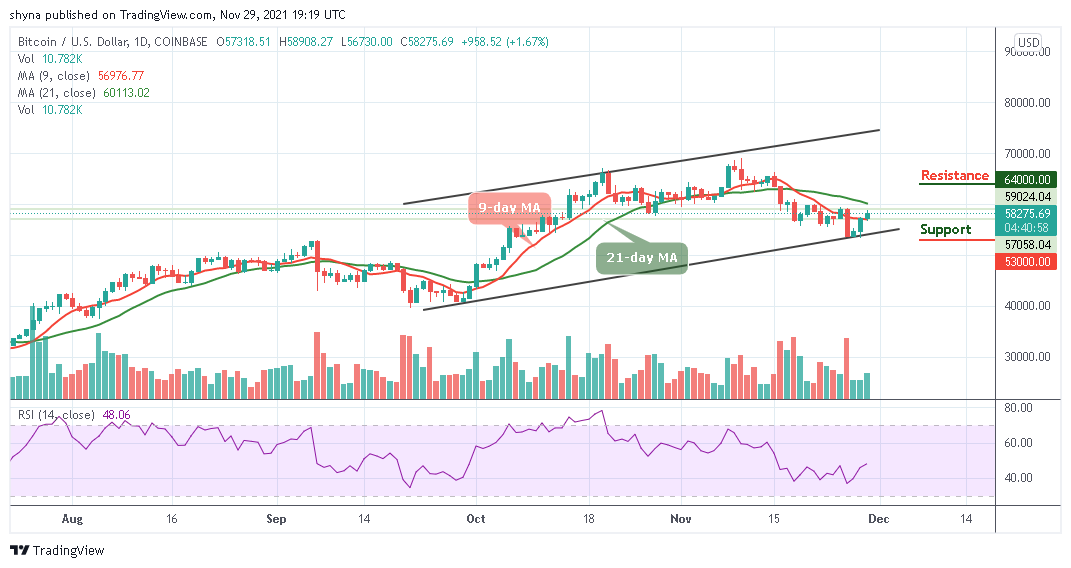
BTC/USD is seen moving towards the 9-day moving average as the coin touches $58,908 in the early hours of today. At the time of writing, BTC/USD market is currently improving, moving it out of the downside to the upside. However, the coin remains within the moving averages as the Bitcoin price is ready to create additional gains and now changing hands at $58,275.
Bitcoin Price Prediction: Bitcoin (BTC) May Give Bullish Signs
At the time of writing, the Bitcoin price is preparing to climb higher above the $60,000 resistance as the coin is settling above the 9-day moving average. However, when the new uptrend movements are beginning to form, buyers may use the 9-day moving average as the nearest support levels. But as soon as the 9-day MA crosses above the 21-day MA, the market may head to the higher levels.
Meanwhile, if the market decides to go down, the Bitcoin price may drop below the lower boundary of the channel and should this barrier fails to contain the sell-off; we may see a further drop to $53,000, $51,000, and $49,000. However, any further movement may locate the resistance levels of $64,000, $66,000, and $68,000 respectively. Meanwhile, the technical indicator Relative Strength Index (14) is likely to cross above 50-level, suggesting more bullish signals.

BTC/USD Medium – Term Trend: Bearish (4H Chart)
Looking at the 4-hour chart, the Bitcoin price is currently trading around $58,044 preparing to cross above the upper boundary of the channel. Meanwhile, we can see that the bullish supply is coming up slowly in the market while the bears are also trying to drag the price down.
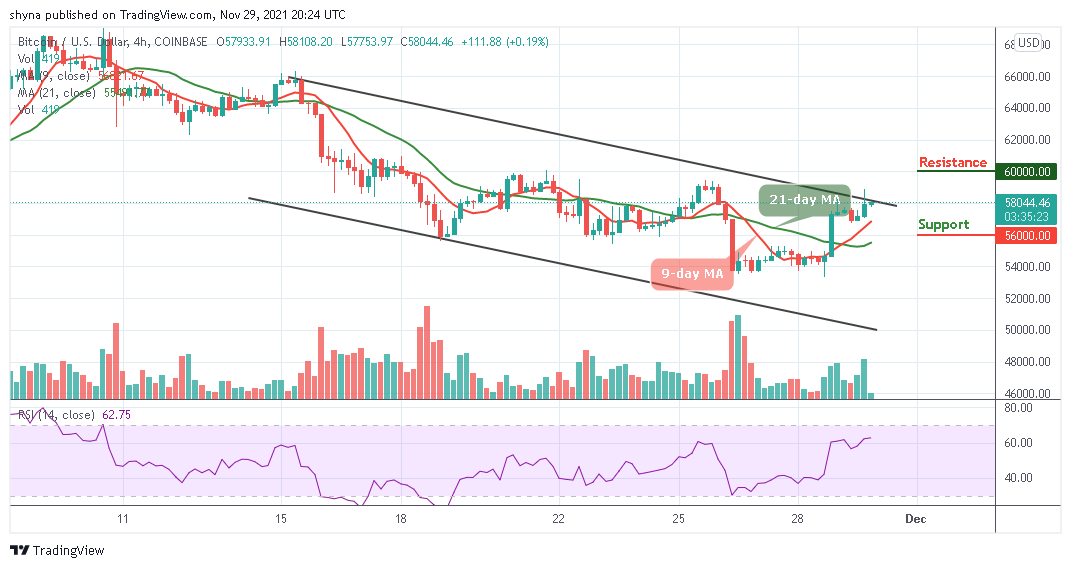
However, if the buyers could strengthen the market, they can further push the price to a $59,000 resistance level. Therefore, breaking the mentioned resistance could allow the bulls to touch the resistance level of $60,000 and above. Meanwhile, the technical indicator Relative Strength Index (14) is moving above 60-level, but any movement to the south may bring the sellers back into the market which could drag the price to the support level of $56,000 and below.
Looking to buy or trade Bitcoin (BTC) now? Invest at eToro!
68% of retail investor accounts lose money when trading CFDs with this provider
Read more:
Credit: Source link


 Bitcoin
  Ethereum
  Tether
  BNB
BNB  Solana
  USDC
USDC  XRP
XRP  Dogecoin
  Toncoin
  Cardano
  Shiba Inu
  Avalanche
  Wrapped Bitcoin
  Bitcoin Cash
  Polkadot
  NEAR Protocol
  Polygon
  Litecoin
  Uniswap
  LEO Token
  First Digital USD
  Hedera
  Aptos
Aptos  Stellar
  Filecoin
  Cosmos Hub
  Render
  OKB
OKB  Pepe
Pepe  Immutable
  XT.com
  dogwifhat
  Bittensor
  Arbitrum
  Maker
Maker  Wrapped eETH
  The Graph
  Optimism
