
Bitcoin Price Prediction – January 3
Today, the Bitcoin price prediction loses traction after touching the low of $46,215; losses likely to continue in the near term.
BTC/USD Long-term Trend: Bearish (Daily Chart)
Key levels:
Resistance Levels: $52,000, $54,000, $56,000
Support Levels: $43,000, $41,000, $39,000
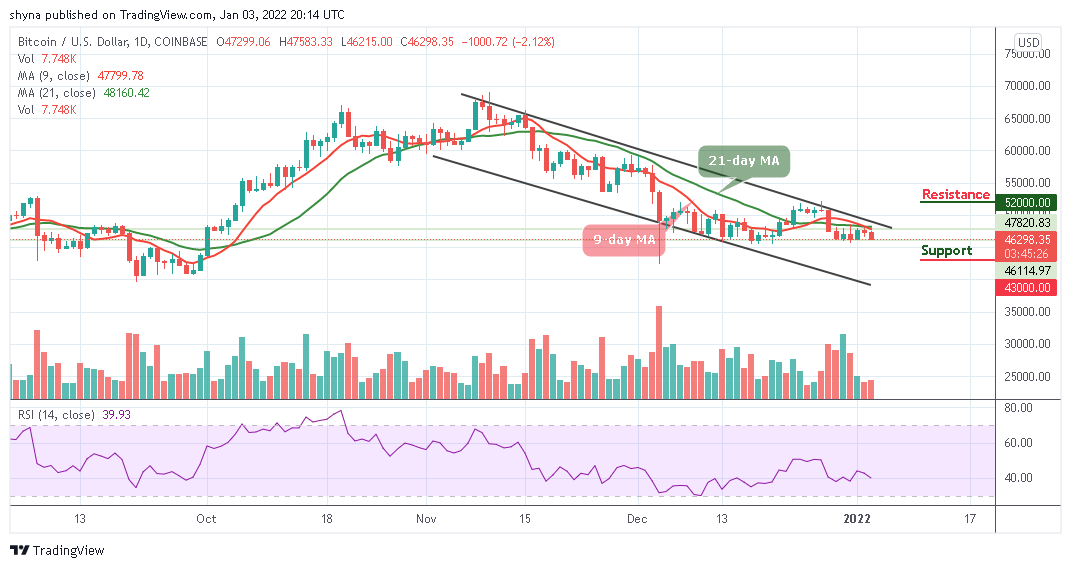
BTCUSD – Daily Chart
Looking at the daily chart, it can be easily seen that the market is back in the red zone as BTC/USD is posting minor losses of 2.12% on the day after commencing the trading at $47,299. It has an intraday high of $47,583; although the world’s largest crypto touches the support level of $46,215 before going back to where it is currently trading at $46,298.
Bitcoin Price Prediction: Bitcoin (BTC) May Cross into the Downside
At the time of writing, the Bitcoin price is plunging below $46,500 one more time, marking $46,215 as the current daily low at the moment. This could mean that Bitcoin (BTC) may be leaving the positive side and searching for a new low. Looking at the declining daily volume candle, together with the steady but stable recent Bitcoin price action, it can be assumed that a stronger move may be coming up soon into the market.
At the time of writing, BTC/USD is struggling to maintain the $46,000 level and if the coin follows the downward trend as the technical indicator Relative Strength Index (14) may cross below 40-level, the next supports may likely come at $43,000, $41,000, and $39,000. On the upside, if the price crosses above the 9-day and 21-day moving averages, further movement could go above the upper boundary of the channel to send the price to the resistance levels of $52,000, $54,000, and $56,000 which will be well above the channel.

BTC/USD Medium-Term Trend: Bearish (4H Chart)
On the 4-Hour chart, BTC price has finally crosses below the support level of $46,000, sliding below the 9-day and 21-day moving averages around $45,822 which may take time to persistently trade above $46,000. In addition, if the bulls gather enough strength and regroup, the upward movement may be able to near the $47,000 and $49,000 resistance level.
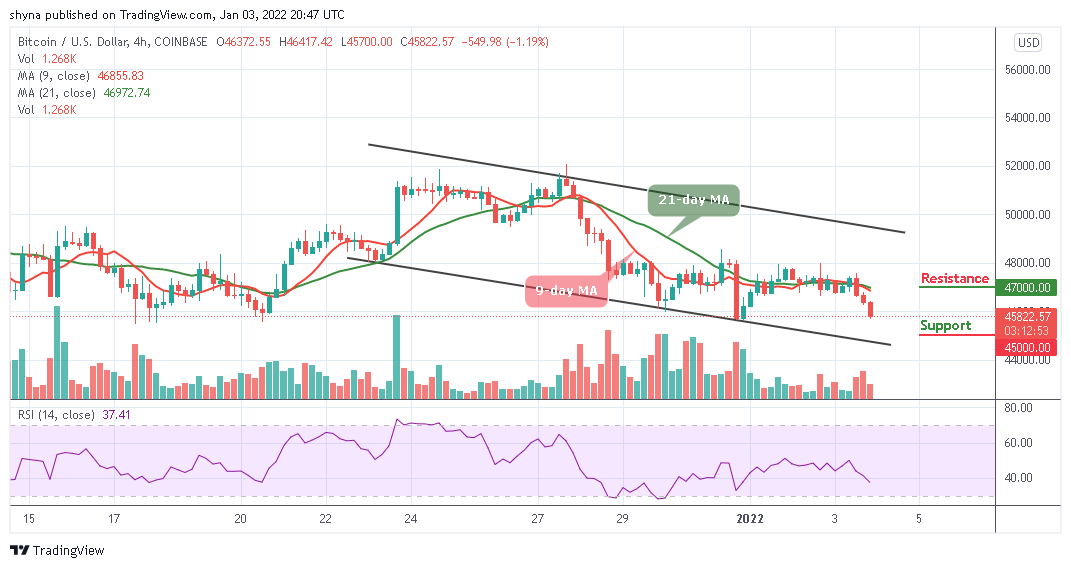
BTCUSD – 4 Hour Chart
However, on the downside, as the Relative Strength Index (14) is crossing below 40-level, the immediate support is around the $45,500 level and the price may likely fall below this level if the bears step back into the market, therefore, a further movement could reach the critical support level at $45,000 and below.
Looking to buy or trade Bitcoin (BTC) now? Invest at eToro!
68% of retail investor accounts lose money when trading CFDs with this provider
Read more:
Credit: Source link


 Bitcoin
  Ethereum
  Tether
  BNB
BNB  Solana
  USDC
USDC  XRP
XRP  Dogecoin
  Toncoin
  Cardano
  Shiba Inu
  Avalanche
  Polkadot
  Wrapped Bitcoin
  Bitcoin Cash
  NEAR Protocol
  Polygon
  Litecoin
  LEO Token
  Uniswap
  First Digital USD
  Aptos
Aptos  Hedera
  Cosmos Hub
  Stellar
  Filecoin
  XT.com
  OKB
OKB  Immutable
  Render
  Optimism
  Arbitrum
  Pepe
Pepe  Sui
Sui  Wrapped eETH
  Maker
Maker  Bittensor
  dogwifhat
