
Bitcoin Price Prediction – March 16
The Bitcoin price prediction shows that BTC is trading at $41,155 as the coin seems to be preparing for another upward movement.
BTC/USD Long-term Trend: Ranging (Daily Chart)
Key levels:
Resistance Levels: $46,000, $48,000, $50,000
Support Levels: $36,000, $34,000, $32,000
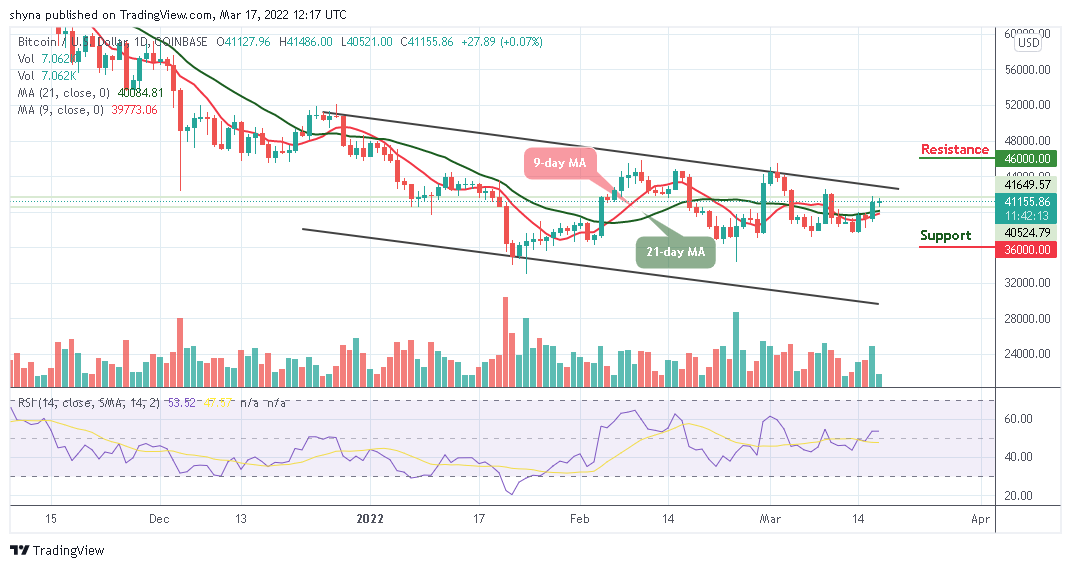
BTC/USD is currently trading above the 9-day and 21-day moving averages at $41,443 155 preparing to cross above the upper boundary of the channel. Today, the largest digital asset is likely to extend towards the resistance level of $42,000 after touching the daily low of $40,521.
Bitcoin Price Prediction: Is $45k Resistance Coming for BTC?
As of now, the Bitcoin price is trading above the moving averages as the next resistance levels could be located at $46,000, $48,000, and $50,000. Typically, when the new uptrends are coming to play, traders could see that the 9-day MA is ready to cross above the 21-day MA to gauge the strength of the trend. However, if BTC/USD keeps soaring towards the channel, it could be a sign of sustainability and may likely result in a bullish continuation.
Nevertheless, should the BTC price fail to move up; traders may see a price cut below the moving averages, and a further low could bring the price to the support levels of $36,000, $34,000, and $32,000 respectively. Now, the bulls are still defending the $41,000 level. But as it stands, the Bitcoin price may rise as the technical indicator Relative Strength Index (14) stays above 50-level.

BTC/USD Medium-Term Trend: Ranging (4H Chart)
Looking at the 4-hour chart, the market is following a sideways movement as the bulls are trying to dominate the market by defending the $40,000 level. If not, the support level of $39,000 and below may come into play.

However, if the bulls keep the market above the 9-day and 21-day moving averages, traders may expect a retest at the $42,000 resistance level, and breaking this level may further push the price towards the resistance level of $43,000 and above. Nevertheless, the technical indicator Relative Strength Index (14) is seen moving below 60-level, suggesting bullish movement for the coin.
Looking to buy or trade Bitcoin (BTC) now? Invest at eToro!
68% of retail investor accounts lose money when trading CFDs with this provider
Read more:
Credit: Source link


 rallying today?")


 Bitcoin
  Ethereum
  Tether
  BNB
BNB  Solana
  USDC
USDC  XRP
XRP  Dogecoin
  Toncoin
  Cardano
  Shiba Inu
  Avalanche
  Wrapped Bitcoin
  Polkadot
  Bitcoin Cash
  NEAR Protocol
  Polygon
  Litecoin
  Fetch.ai
  Uniswap
  LEO Token
  Render
  Hedera
  First Digital USD
  Aptos
Aptos  Cosmos Hub
  Pepe
Pepe  Filecoin
  Wrapped eETH
  Stellar
  OKB
OKB  Immutable
  dogwifhat
  Arbitrum
  Optimism
  Bittensor
  Arweave
  The Graph
  Pumps Over 20%")
