Join Our Telegram channel to stay up to date on breaking news coverage
The Cartesi price prediction is getting ready to cross above the upper boundary of the channel after a rapid retracement.
Cartesi Prediction Statistics Data:
- Cartesi price now – $0.24
- Cartesi market cap – $177.6 million
- Cartesi circulating supply – 769 million
- Cartesi total supply – 1 billion
- Cartesi Coinmarketcap ranking – #250
CTSI/USD Market
Key Levels:
Resistance levels: $0.28, $0.30, $0.32
Support levels: $0.20, $0.18, $0.16
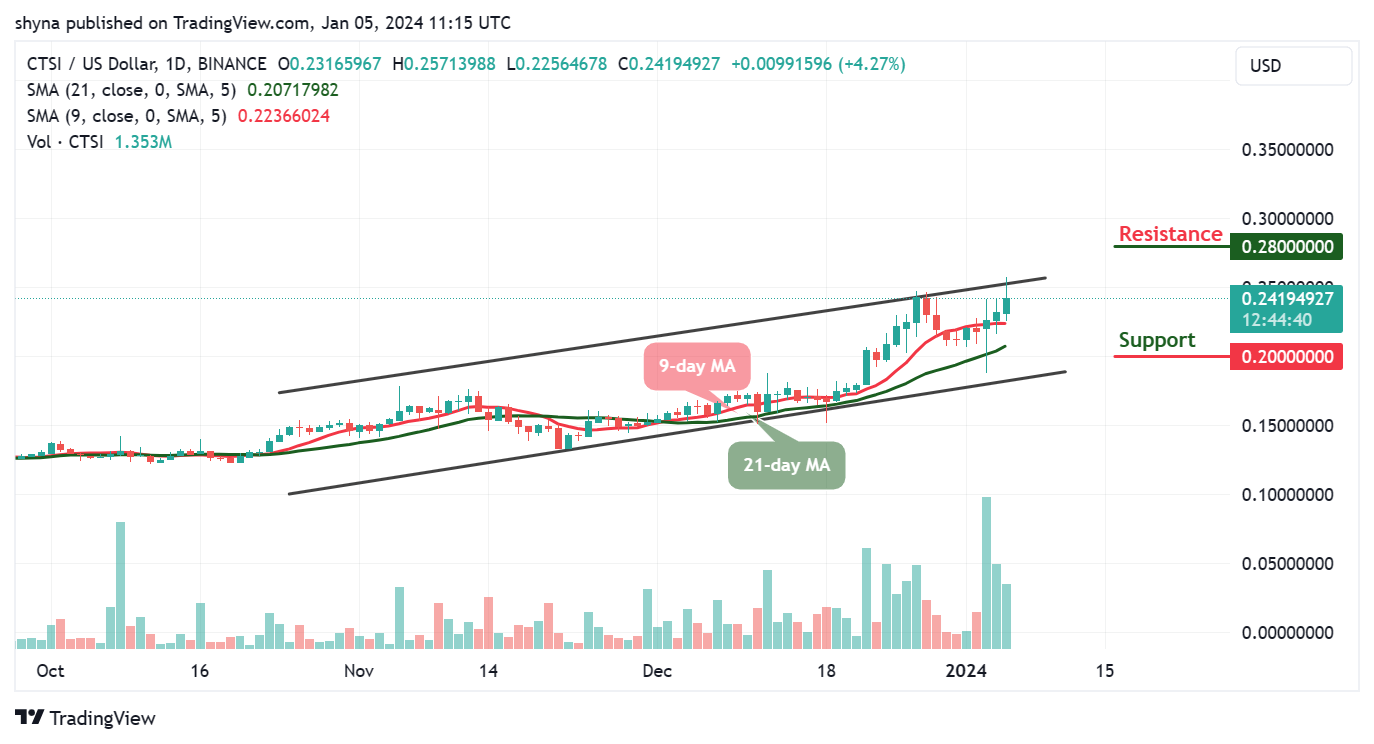
CTSI/USD is currently recovering above the opening price of $0.25 and it is likely to climb above $0.26 soon. Meanwhile, the Cartesi price is now trading above the 9-day and 21-day moving averages as bulls begin to dominate the market.
Cartesi Price Prediction: CTSI May Cross Above the Channel
The Cartesi price may cross above the upper boundary of the channel. However, if CTSI/USD breaks above the channel, it could visit an important resistance at $0.26. Therefore, a successful break above this level could open another increase above the $0.27 level and the price is likely to rise toward the $0.28, $0.30, and $0.32 resistance levels in the next positive direction.
As the technical indicator, the coin may spike to create additional gains, but crossing below the 9-day and 21-day moving averages could touch the $0.22 support. The next major support is toward the lower boundary of the channel, where the bulls are likely to take a strong stand but any further losses could lead the price to $0.20, $0.18, and $0.16 support levels.
CTSI/BTC Begins the Upward Movement
Against Bitcoin, the Cartesi price is now moving above the 9-day and 21-day moving averages as the market keeps moving around the upper boundary of the channel. Meanwhile, the 9-day moving average keeps hovering above the 21-day moving average confirming the bullish movement.
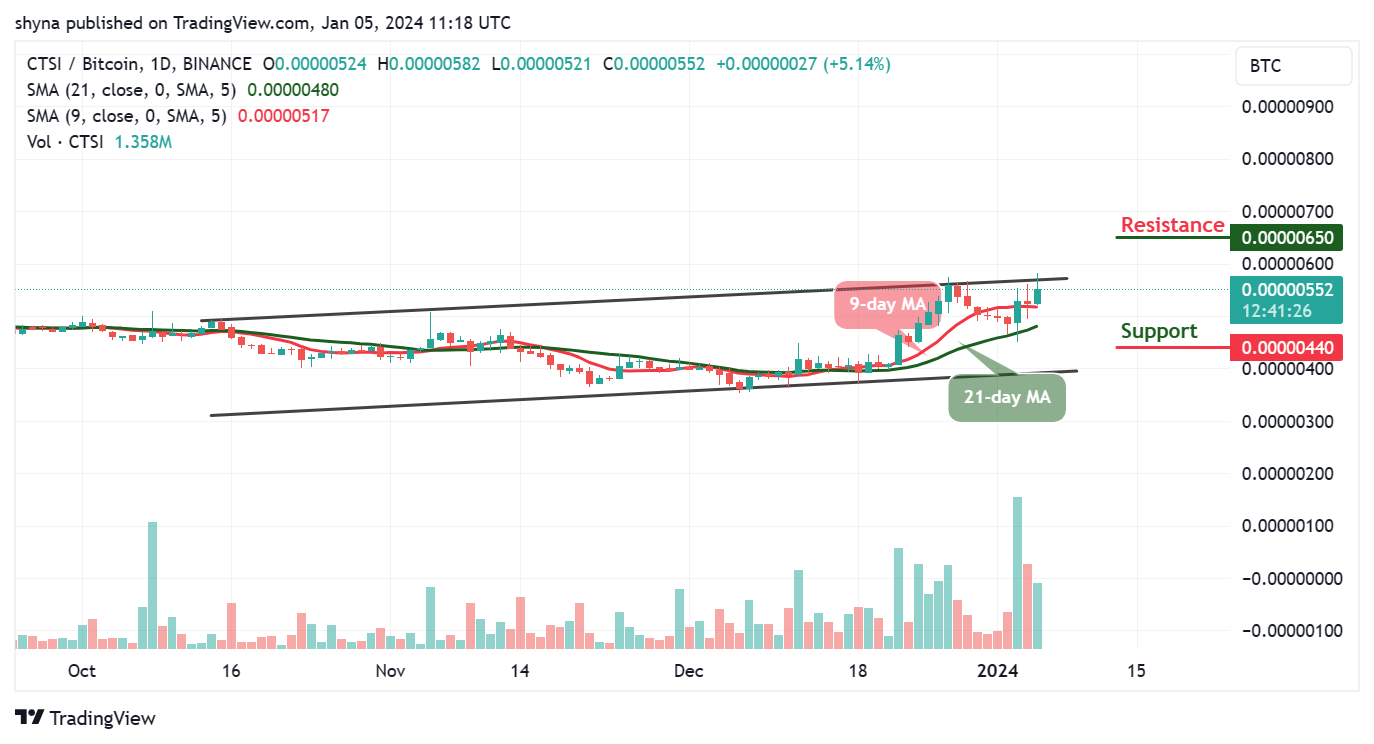
However, if the price breaks above the upper boundary of the channel, bulls might push the market back to the resistance level of 582 SAT. Moreover, if the price stays above this level, it could hit the resistance level of 650 SAT and above. On the other hand, sliding below the moving averages may locate the support level at 440 SAT and below.
Cartesi Alternatives
Based on the daily chart analysis, the Cartesi price surges past the $0.25 mark, setting the stage for potential bullish indicators as the coin aims to breach the upper boundary of the channel, potentially propelling its value higher. Nonetheless, should the bullish momentum escalate, there’s a chance that Cartesi (CTSI) might encounter resistance around the $0.30 level.
However, investors should evaluate both Cartesi (CTSI), boasting a market cap of $177.6 million, and Bitcoin Minetrix, an emerging low-cap token that gathered over $7.5 million during its presale phase. While CTSI provides stability given its recognized market presence, Bitcoin Minetrix offers the allure of substantial returns as a promising low-cap alternative.
New Crypto Mining Platform – Bitcoin Minetrix

- Audited By Coinsult
- Decentralized, Secure Cloud Mining
- Earn Free Bitcoin Daily
- Native Token On Presale Now – BTCMTX
- Staking Rewards – Over 100% APY
Join Our Telegram channel to stay up to date on breaking news coverage
Credit: Source link


")


 could face regulatory inquiries in UK")


 Bitcoin
  Ethereum
  Tether
  BNB
BNB  Solana
  USDC
USDC  XRP
XRP  Dogecoin
  Toncoin
  Cardano
  Shiba Inu
  Avalanche
  Polkadot
  Wrapped Bitcoin
  Bitcoin Cash
  Polygon
  NEAR Protocol
  Litecoin
  LEO Token
  Uniswap
  First Digital USD
  Aptos
Aptos  Hedera
  Cosmos Hub
  Pepe
Pepe  Filecoin
  Stellar
  Immutable
  XT.com
  Render
  Optimism
  OKB
OKB  Arbitrum
  dogwifhat
  Bittensor
  Sui
Sui  Wrapped eETH
  Maker
Maker 
