
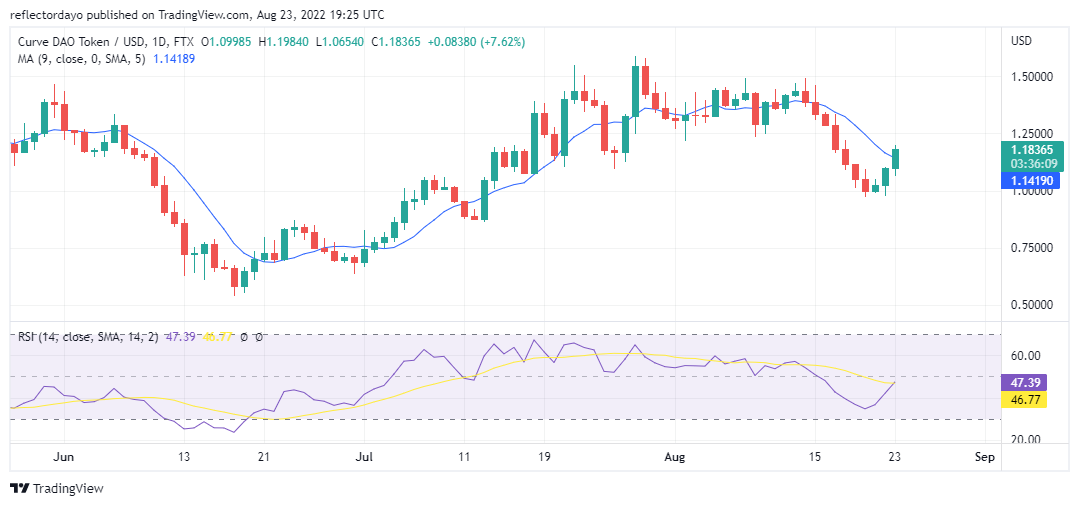
The CRV/USD downward trend started on the 14th of August. It took the price to the low of $0.99734776 from$1.43650343 which also forms the new support level. On the 21st of August, after the price action have settled on the support level, bulls became strong enough to prevent any further downward push of the price by the bears. This marked the beginning of the trend reversal. Bulls take the three consecutive days. The 22nd of August started with the bears winning then along the line, bulls pushed back the price beyond the bearish opening price to result in the day’s bullish win. The same thing happened today.
Curve Price Statistic Data:
- CRV/USD price now: $1.18225541
- CRV/USD market cap: $622,046,768
- CRV/USD circulating supply: 528,059,717 CRV
- CRV/USD total supply: 1,808,625,798CRV
- CRV/USD coin market ranking: #68
Key Levels
- Resistance: $1.540513981, $1.44420792, $1.18225541
- Support: $0.99734776, $1.29011821, $1.16684644
Buy curve Now
Your capital is at risk

Curve Price Analysis: The Indicator’s Point of View
In a broad view, Curve price is trending up. Although there are significant bearish moves on the chart, we can see that the price keeps bouncing at a higher support level. This is an indication that the bulls have control over most of the market sessions. In the Relative Strength Index, the two lines cross each other in the lower section of the RSI indicator. Both the RSI line and the MACD line cross today on the daily chart. And both of them measure 46%. This is a good indication that the trend which was bearish before is now starting a bullish one. Another thing to note is that today’s price action has caught up with the 9-day moving average. There is the possibility that the bulls leap over the moving average in the next trading session.
Curve Price Analysis: CRV/USD 4-Hour Chart Outlook
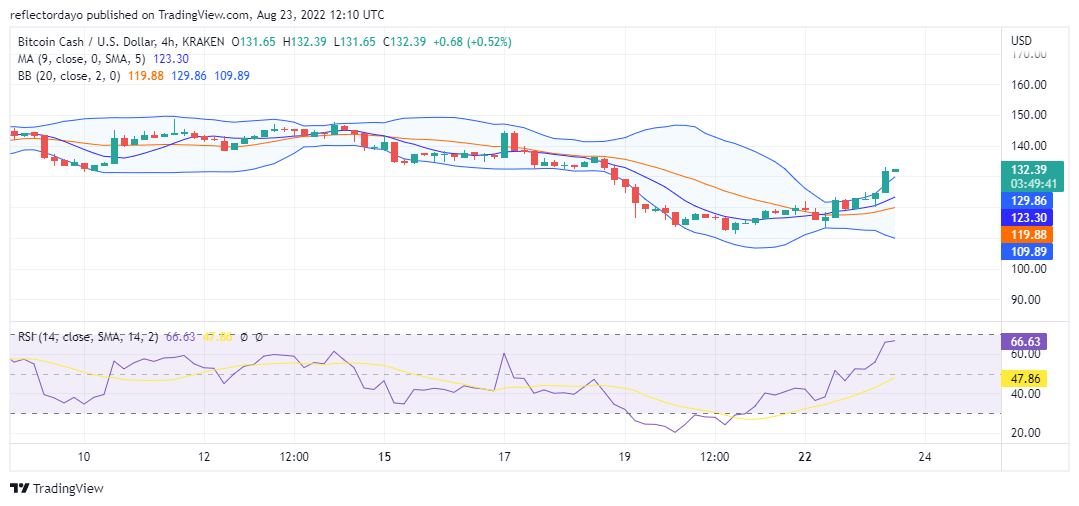
In the 4-hour chart outlook, we see from the Relative Strength Index that the bulls are very aggressive. The RSI line moves at a very strong momentum measuring 66%. This strong momentum started yesterday and it had remained strong till the time of writing this analysis. When we take a look at the Moving Average Convergence and Divergence (MACD), we see very strong histograms. Those histograms are characterised by green colour. This is a sign of a strong bullish market. From these observations, it is likely that may CRV/USD reach the new support of $1.25000
Related
Tamadoge – Play to Earn Meme Coin

- Earn TAMA in Battles With Doge Pets
- Capped Supply of 2 Bn, Token Burn
- NFT-Based Metaverse Game
- Presale Live Now – tamadoge.io
Credit: Source link


 Bitcoin
  Ethereum
  Tether
  BNB
BNB  Solana
  USDC
USDC  XRP
XRP  Dogecoin
  Toncoin
  Cardano
  Shiba Inu
  Avalanche
  Wrapped Bitcoin
  Bitcoin Cash
  Polkadot
  NEAR Protocol
  Polygon
  Litecoin
  Uniswap
  LEO Token
  First Digital USD
  Hedera
  Aptos
Aptos  Stellar
  Cosmos Hub
  Filecoin
  OKB
OKB  Immutable
  Render
  XT.com
  Pepe
Pepe  Arbitrum
  Bittensor
  dogwifhat
  Maker
Maker  Wrapped eETH
  The Graph
  Optimism
